Financial reports: a tour of every billing report
MarkTrack comes with a set of built-in financial reports that turn your invoices and payments into answers: who owes you money and how late they are, how much you collected this month, which families have a balance, and how revenue breaks down by school or grade. This guide tours every report, explains when to reach for each one, walks through the date and period filters, and shows how to export a report to PDF or CSV.
Reports are per school. If you are viewing a single school, every report only counts that school's invoices and payments. The reports read your live data — there is nothing to "build" or refresh. Open one and it reflects the invoices and payments exactly as they stand right now. They are read-only: opening a report never changes an invoice or sends anything to a family. For creating the invoices these reports measure, see Create and send invoices.
Step 1 — Open the Reports menu
All financial reports live behind one button on the Billing page.
- Go to Billing → Tuition.
- In the row of quick-action buttons near the top, click Reports.
- The Billing Reports window opens ("Financial insights and analytics") with one card per report.
- Click any card to open that report on its own page. Use your browser's back button (or the back arrow on the report) to return to Billing.
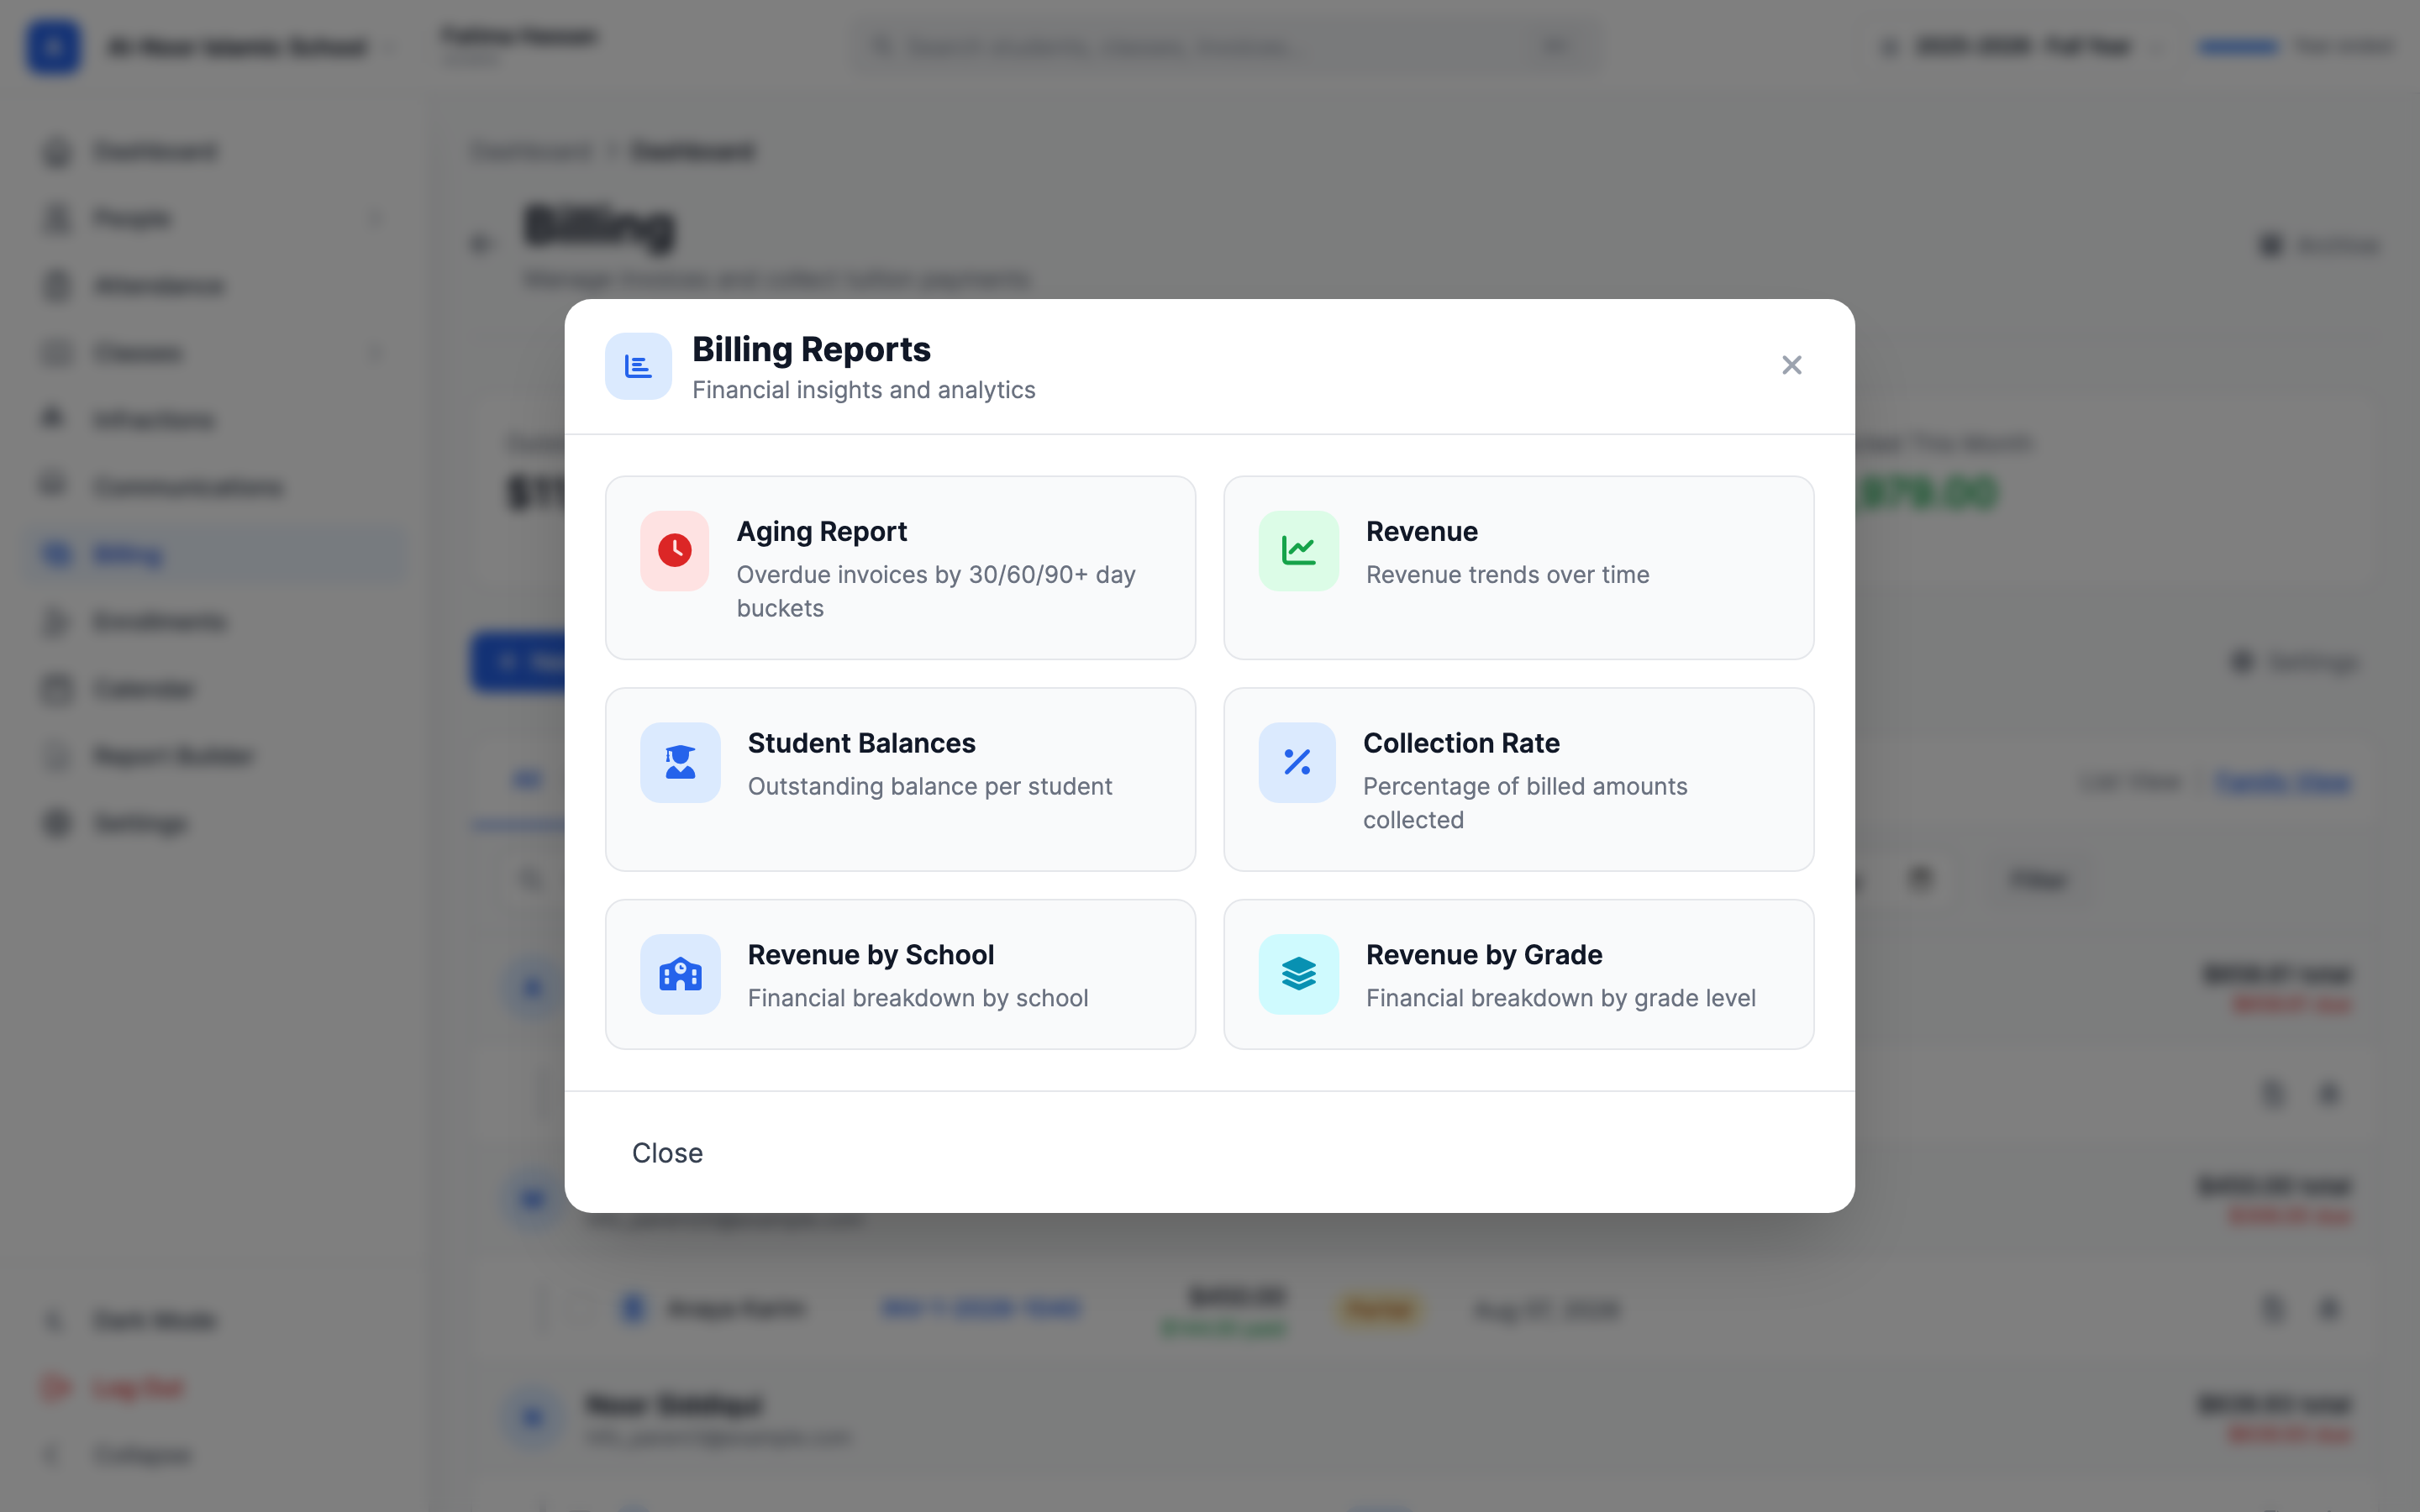
There are six reports
Aging, Revenue, Student Balances, Collection Rate, Revenue by School, and Revenue by Grade. Each is covered below.
Step 2 — Aging Report: who is overdue and by how long
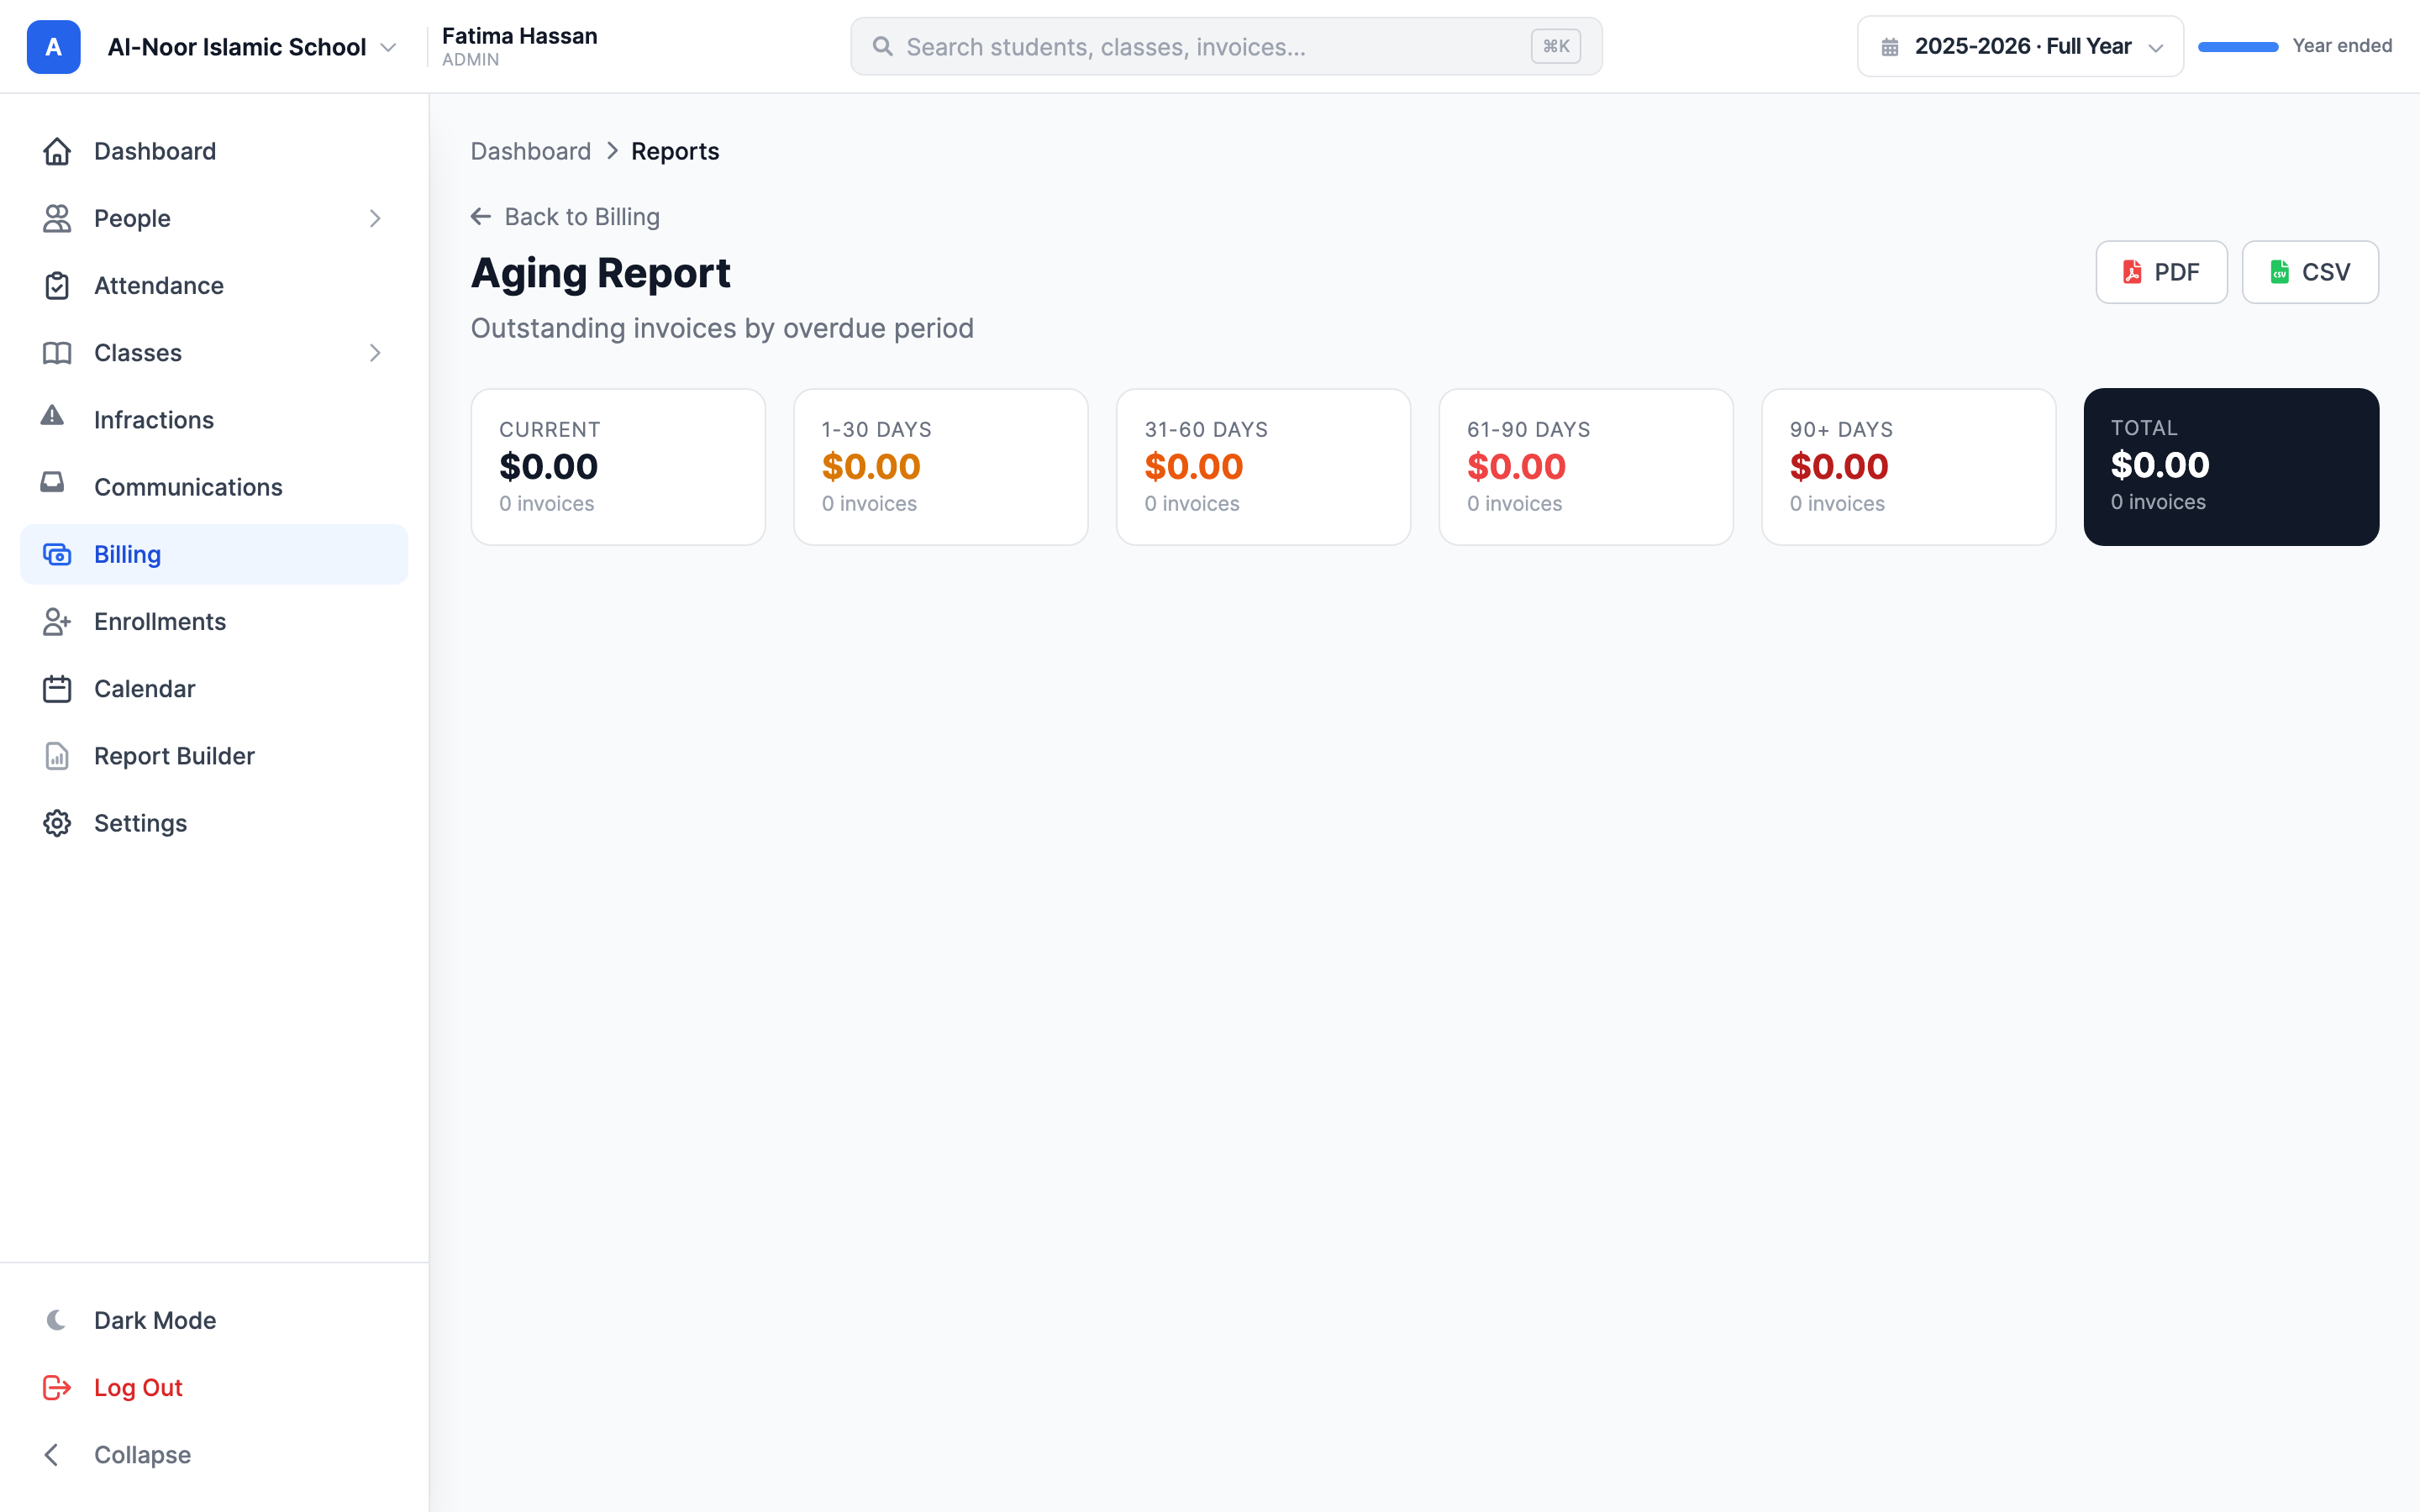
The Aging Report takes every unpaid invoice and sorts it into buckets by how many days past its due date it is. Use it to decide who to chase first — the longer a balance has been outstanding, the more attention it needs.
The buckets are:
- Current — not yet due (the due date is today or later).
- 1-30 Days — 1 to 30 days overdue.
- 31-60 Days — 31 to 60 days overdue.
- 61-90 Days — 61 to 90 days overdue.
- 90+ Days — more than 90 days overdue.
At the top, summary cards show the total dollar amount and invoice count in each bucket, plus a grand Total. Below them, a table per bucket lists each invoice with its Invoice number, Parent, Student, Due Date, and Amount Due. Click an invoice number to jump straight to that invoice.
Invoices with no due date are skipped
An invoice can only be aged if it has a due date. Unpaid invoices that were never given a due date do not appear in any bucket. If a balance you expect is missing, open the invoice and check it has a due date.
Step 3 — Revenue Report: how much you collected, and how
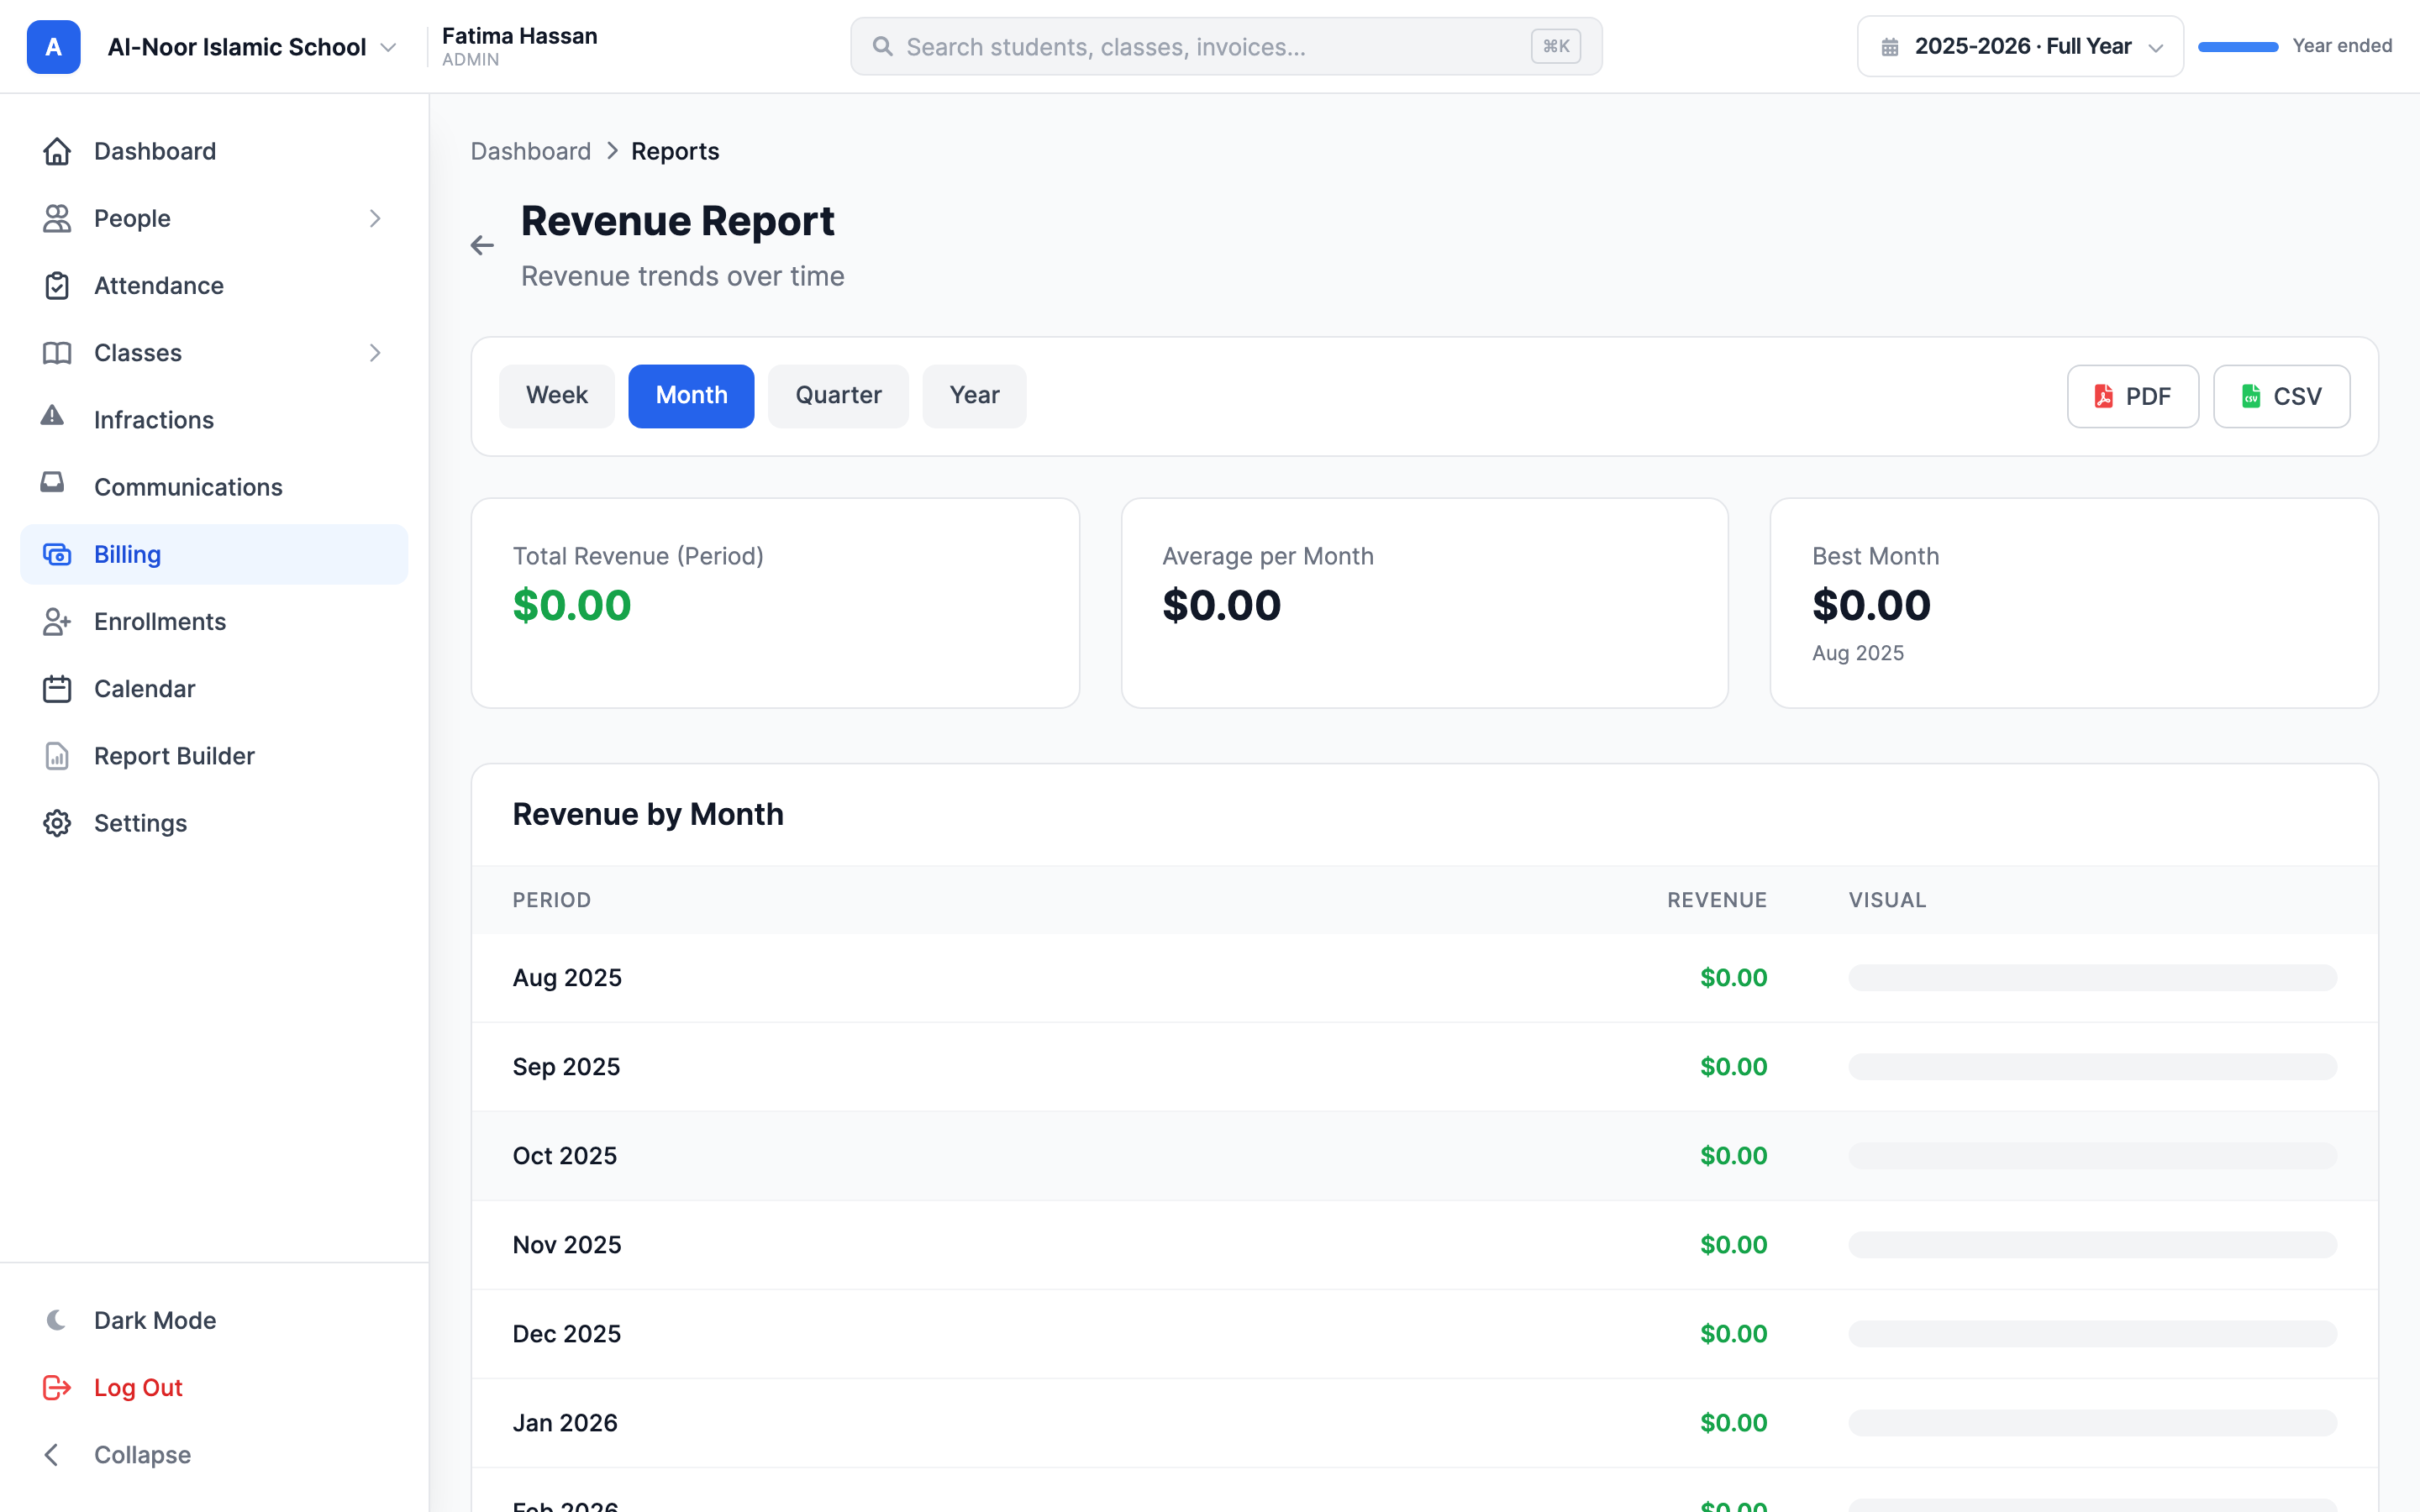
The Revenue Report shows money you actually collected over time — successful payments, not amounts billed. Use it to see trends and your best periods.
At the top is a period filter. Click Week, Month, Quarter, or Year to change the time grain. The page updates immediately:
- Week — the last 12 weeks, one row each.
- Month — the last 12 months (this is the default).
- Quarter — the last 8 quarters.
- Year — the last 5 years.
Three summary cards show Total Revenue (Period), Average per period, and your Best period. Below that, a Payments by Method panel breaks the same window down into Cash, Check, Card, ACH, and Other — with a count, dollar total, and percentage for each. A table at the bottom lists revenue per period with a bar so you can eyeball the trend.
Cash and check count here too
The Payments by Method panel includes the cash and check payments you record by hand, not just online card and bank payments. Refunds are netted out, so a refunded payment lowers the totals automatically.
Step 4 — Student Balances: what each student owes
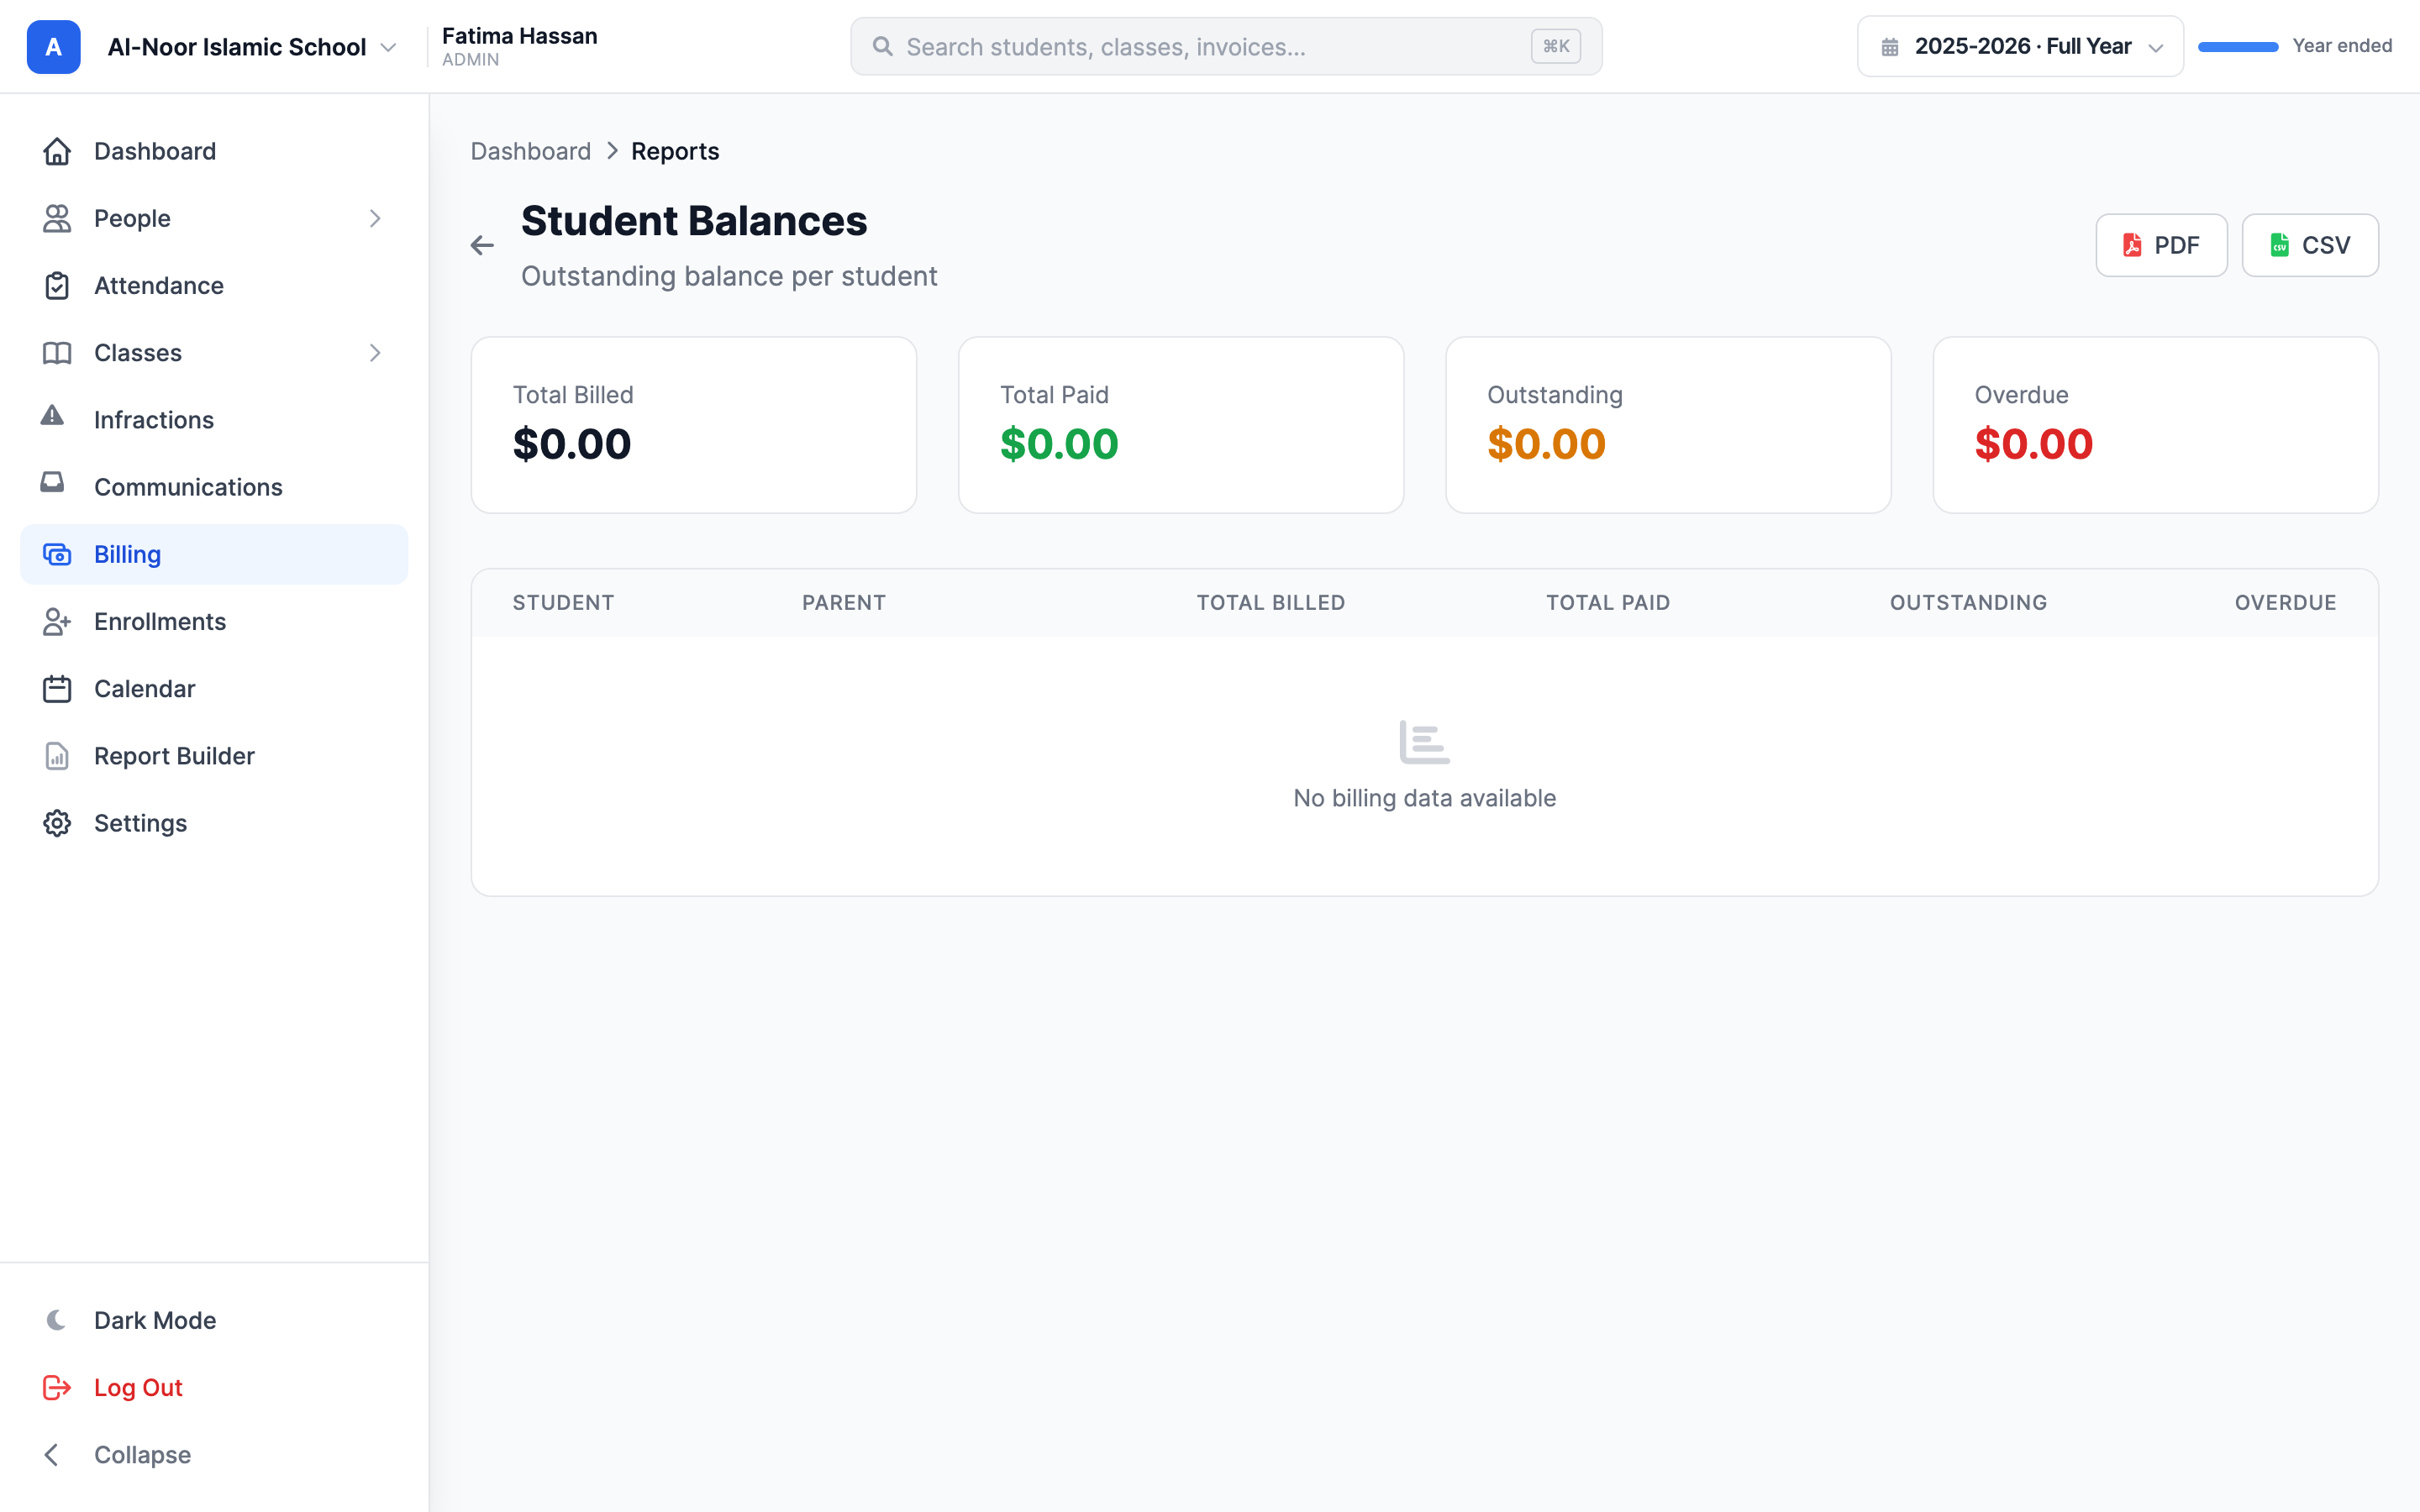
The Student Balances report lists every student who has any invoices, with one row per student showing Total Billed, Total Paid, Outstanding (still owed), and Overdue (the part of the outstanding that is past its due date). The Parent column tells you who to contact. Students with nothing billed are left off.
Use this when a parent asks "what do we owe?" or when you want a single roster of balances to reconcile against your own records.
Step 5 — Collection Rate: are families paying on time?
The Collection Rate report compares, month by month for the last 12 months, how much you Billed against how much you Collected, and shows the Rate as a percentage. A rate near 100% means families paid close to what you charged that month; a low rate means money is going uncollected.
The percentage can read oddly across months
Each month's rate divides the money collected in that calendar month by the amount billed in that same month. A payment for last month's invoice that arrives this month counts toward this month's collected, so a single month's rate can go above 100% or look low. Read the trend across several months, not any single number.
Step 6 — Revenue by School and Revenue by Grade
These two reports slice the same money — billed, paid, outstanding, overdue — by a different grouping.
- Revenue by School — one row per school, plus a Students count. Helpful when your organization runs more than one school (for example a weekend school and a Hifz program) and you want to compare them side by side.
- Revenue by Grade — one row per Grade/Level, based on the classes each student is enrolled in. Use it to see which grade levels carry the most outstanding balance.
Both reports add an Unassigned row for money that does not fall into any group — invoices with no school set, or students not enrolled in any class.
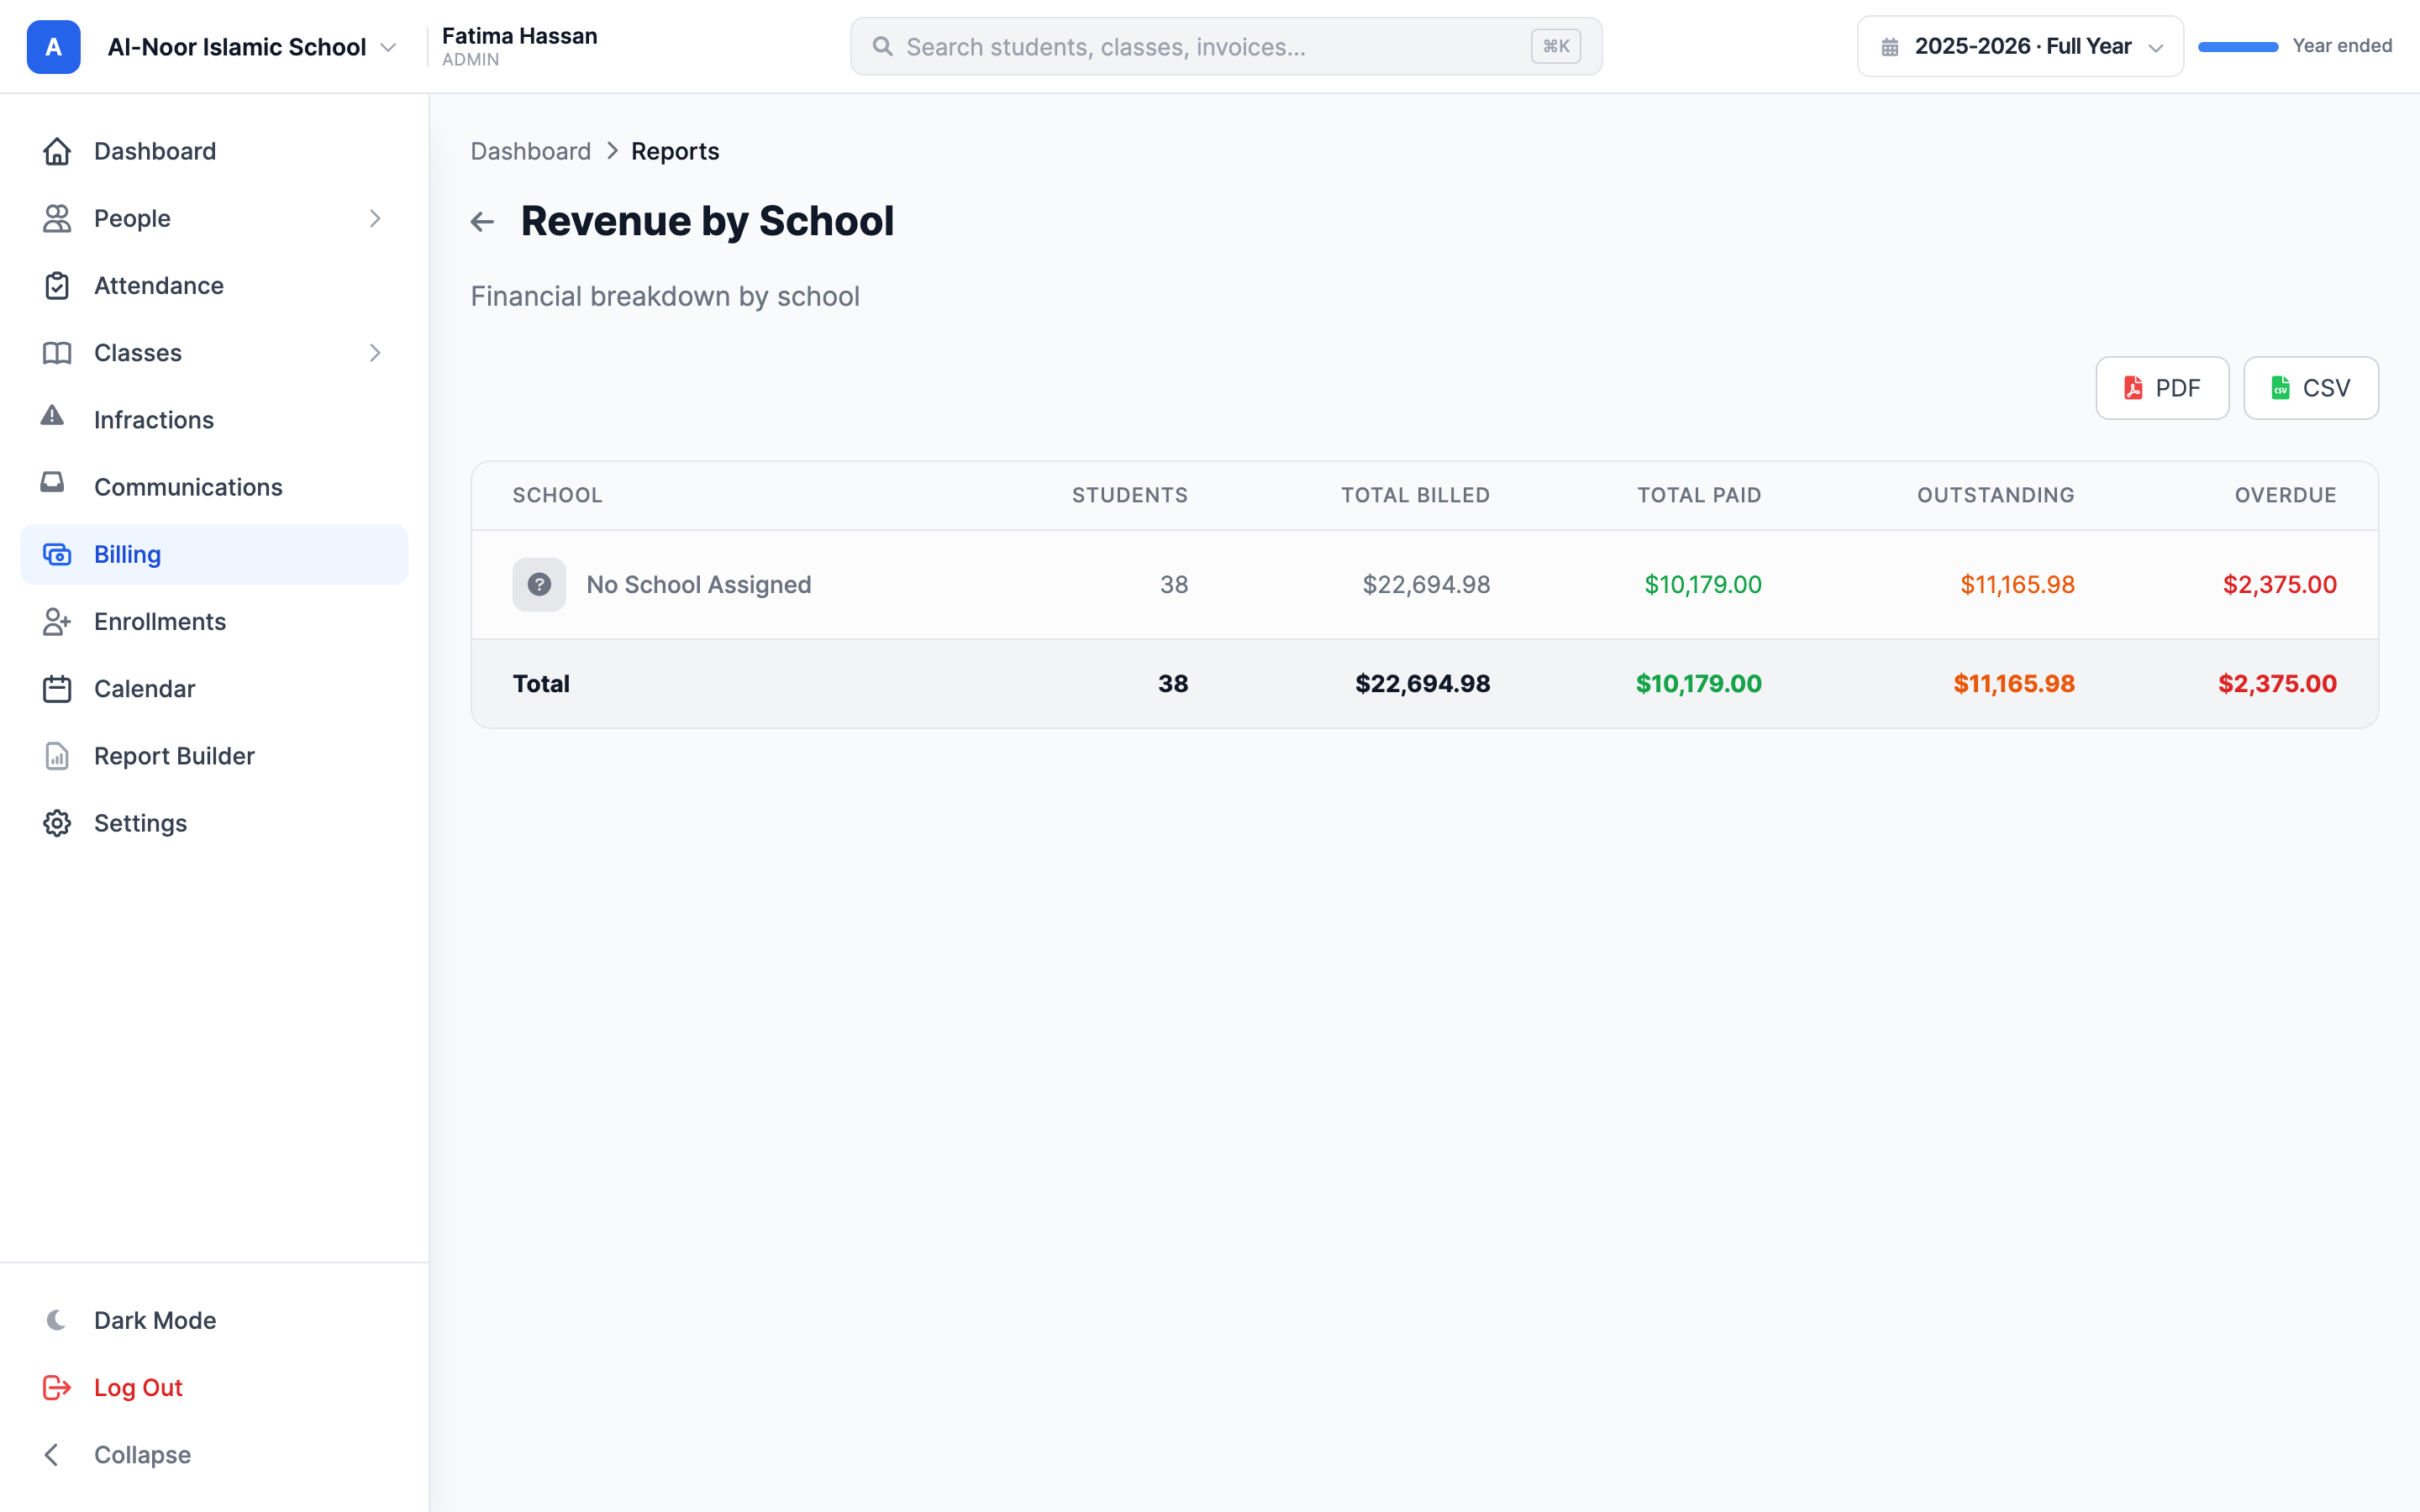
"Revenue by School" always covers the whole organization
Most reports respect the single school you are viewing, but Revenue by School lists every school in your organization on purpose — that is the point of the report. The other five reports stay scoped to the school you have open.
Step 7 — Export a report to PDF or CSV
Every report page has its own export buttons in the top-right corner. There is nothing to wait for — clicking a button downloads the file straight away.
- Open the report you want.
- Click PDF for a printable, formatted copy (it opens in a new tab). Use this to file, print, or share with your board.
- Click CSV for a spreadsheet copy. Use this to open in Excel or Google Sheets, sort, or import into your accounting tool.
- The file name includes the report name and today's date, so downloads stay organized.
On the Revenue Report, the export matches the period you have selected — pick Quarter first, then click PDF or CSV to export the quarterly view.

CSV vs. PDF
PDF is for reading and printing. CSV is for crunching numbers — it gives you the underlying rows (for the Aging Report, that includes every invoice with its days-overdue and bucket) so you can re-sort or reconcile in a spreadsheet.
Which report should I use?
- "Who do I need to chase, and how urgently?" → Aging Report.
- "How much did we bring in this month / quarter?" → Revenue Report.
- "What does this family / student owe?" → Student Balances.
- "Are people paying on time?" → Collection Rate.
- "How do our schools compare?" → Revenue by School.
- "Which grade levels owe the most?" → Revenue by Grade.
All six reports read straight from your invoices and payments, so the cleaner your invoicing, the sharper these numbers are. If a total looks off, start with the invoices behind it — see Create and send invoices. Still stuck? Contact us and we'll help you read the numbers.
More in Billing & Tuition
Still stuck?
Our team is happy to walk you through it.