Use the AI report builder and templates
The Reports page is MarkTrack's report builder. It ships with a catalog of ready-made reports — attendance, grades, directory, Hifz, behavior, and billing — that you open, fine-tune with a few filters, and export as a clean PDF. There is nothing to set up: every report reads your live data, so the numbers are always current. This guide covers finding a report, customizing it, styling it, and saving it so you can re-run it later.
Reports are per school. The page only ever shows data for the school you're currently in, and a school-scoped admin can only pick students, classes, and parents from their own campus. Switch schools first if you want a different campus's numbers.
Where to find it
In the left sidebar, click Reports. Reports is admin-only. If you don't see it, your account may not have the report builder enabled — contact your school owner.
Step 1 — Pick a report from the catalog
The Reports page opens on a single table listing every report, grouped under tabs across the top: All, Attendance, Grades, Directory, Hifz, Behavior, Billing, and Profile. A separate Report Cards tab opens its own panel (covered in Generate and email report cards).
- Click a tab to narrow the list to one category, or stay on All.
- Or type into the Search reports box (top right) to filter by name, description, or category as you type — for example "absent", "balances", or "roster".
- Click any row to open that report. The Run button appears on the row as you hover.
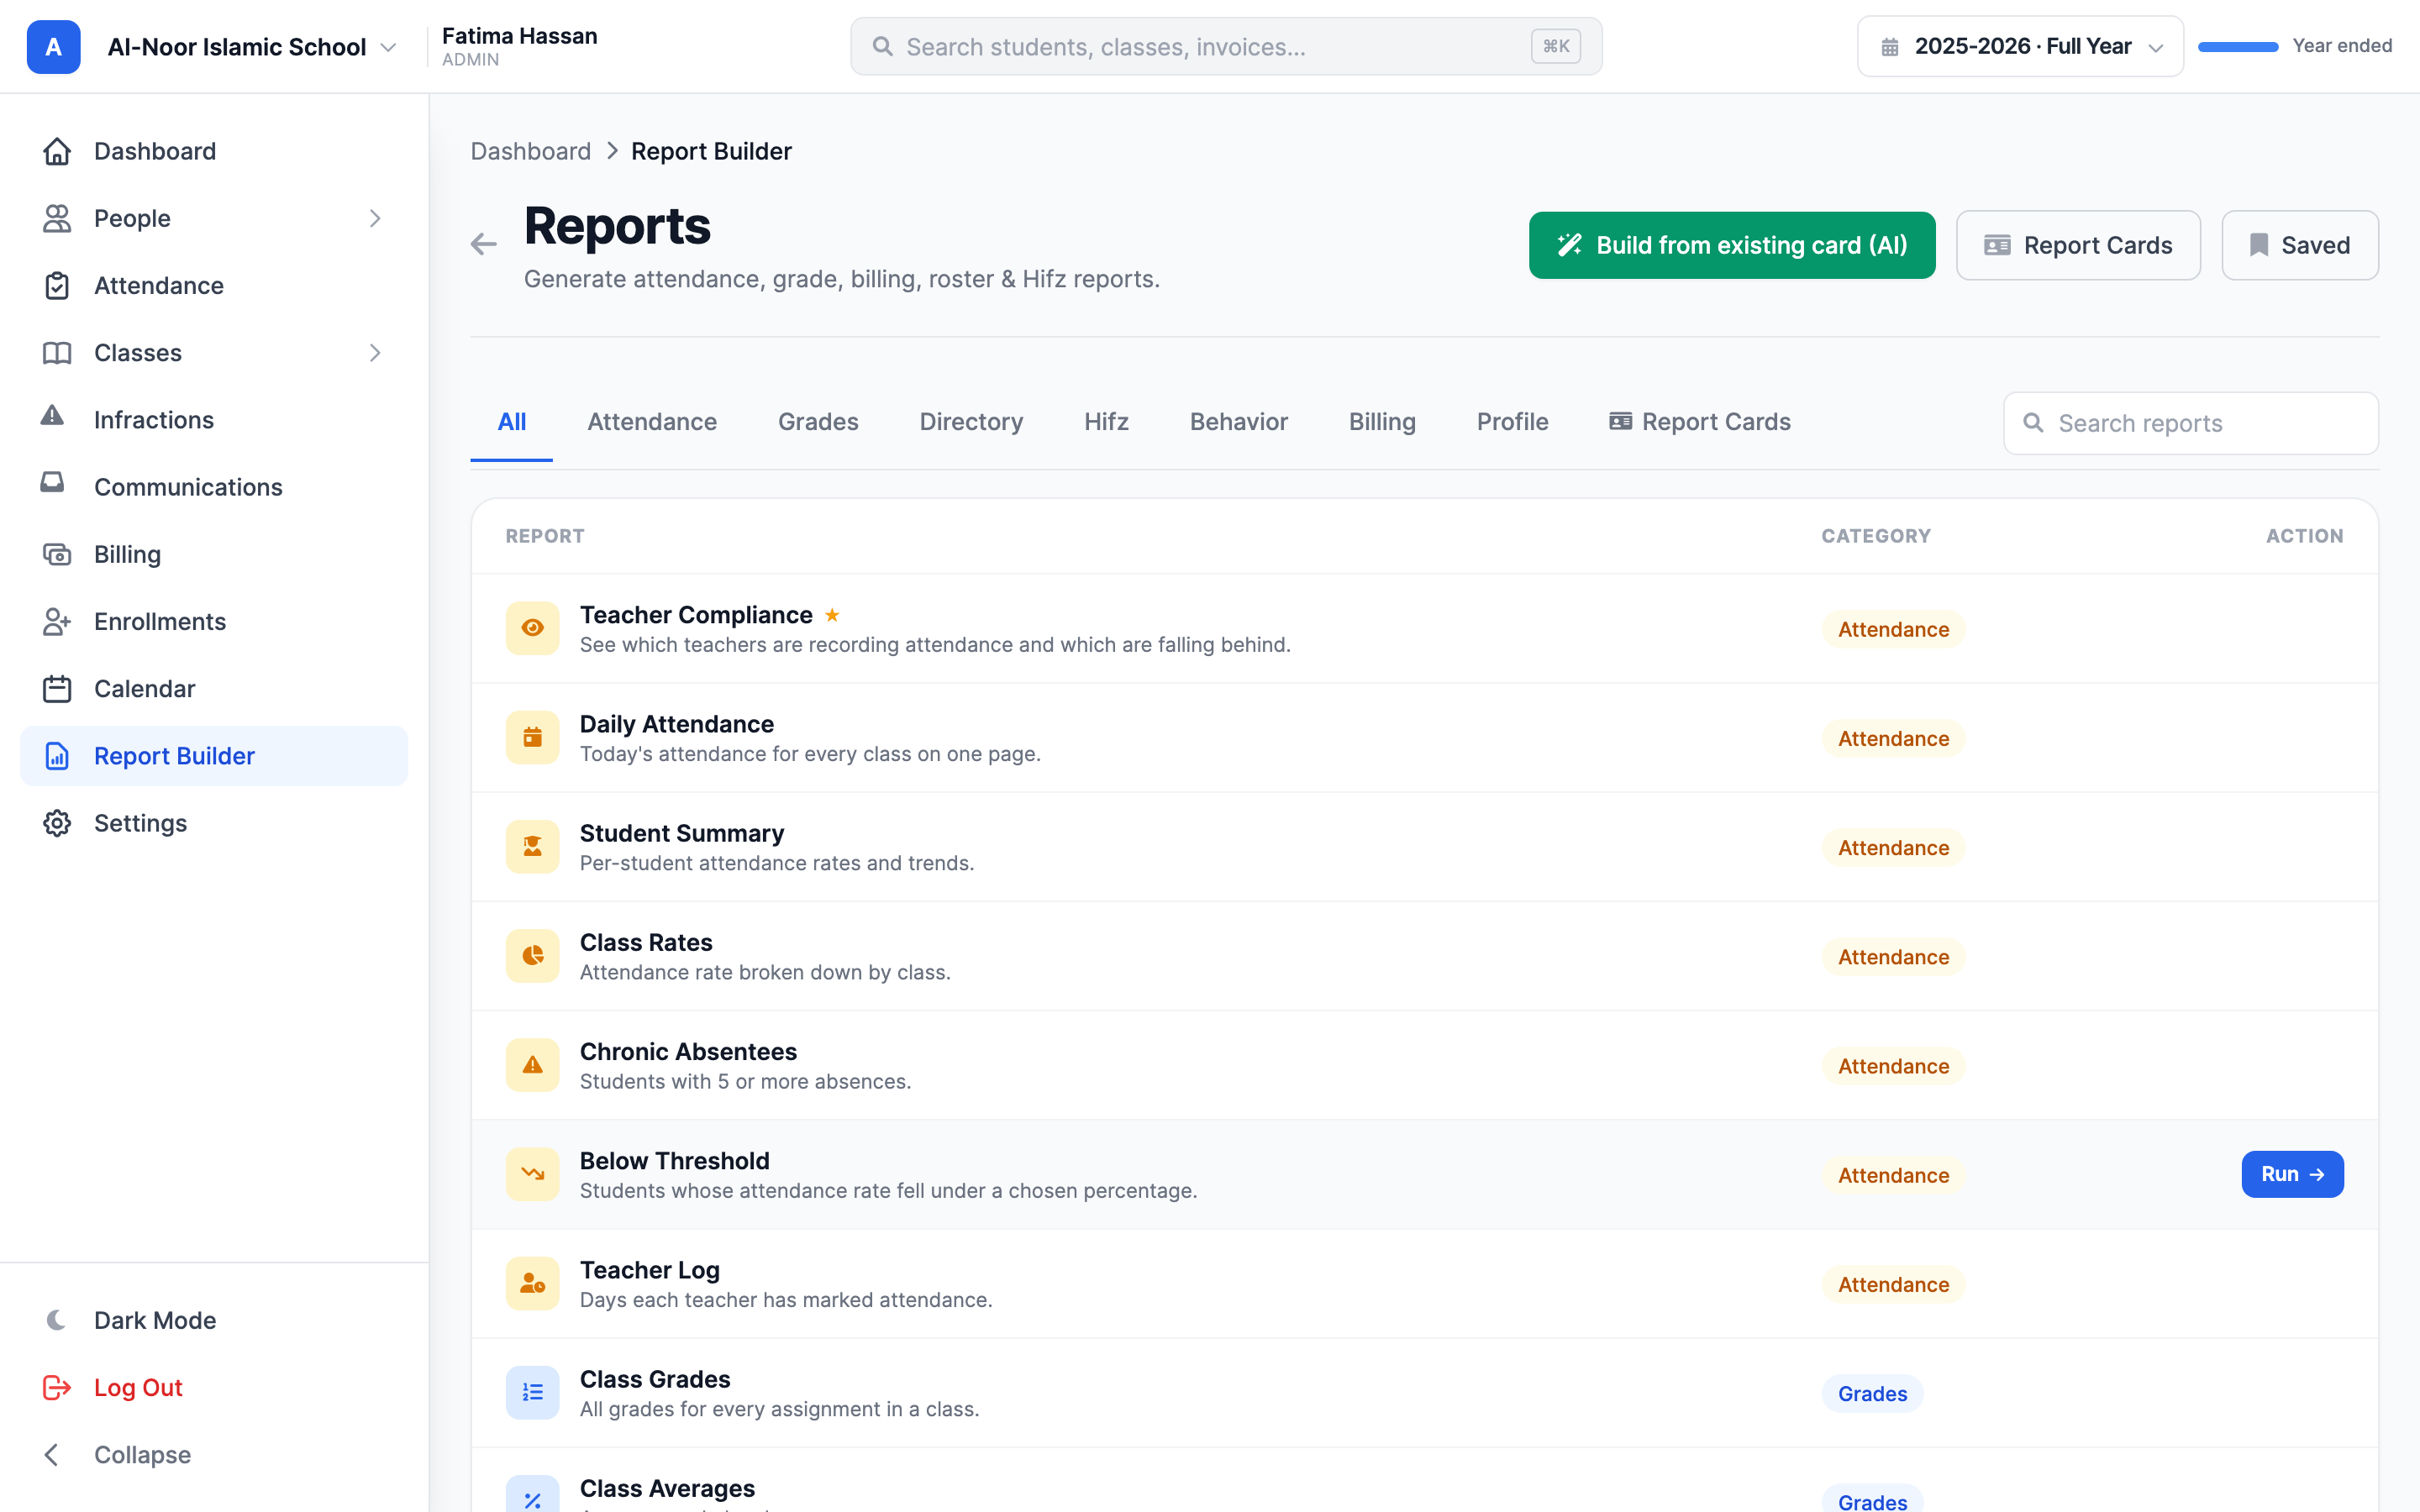
A few of the most-used reports, so you know what's in the box:
- Attendance — Teacher Compliance (who's recording attendance), Daily Attendance, Student Summary, Chronic Absentees (5+ absences), Below Threshold.
- Grades — Class Grades, Class Averages, Failing Students (below 60%), Top Students, Distribution (A/B/C/D/F).
- Directory — Student Directory, Parent Directory, Class Roster, Teacher Workload, Missing Information.
- Billing — Outstanding Balances, Family Summary, Payment History, Revenue Summary, Overdue Aging.
- Hifz and Behavior — Hifz Progress, Inactive Students, Infraction Log, Repeat Offenders, Pending Follow-Up.
Step 2 — Customize the report in the control rail
When you open a report, it loads immediately on the right, and a Customize rail appears on the left. Every change you make in the rail updates the report live — there's no "apply" button to press. The rail only shows the controls a given report actually uses, grouped into up to four sections:
- Time period — for date-driven reports. Pick a quick range (Last 7 days, Last 30 days, Year to date), a named term, This term, Last term, or Custom to type your own start and end dates. The report header always prints the real dates behind your choice, so "This term" shows the actual window.
- Scope — narrow to a specific class, student, parent, or school. Leave a picker on its "All" option to include everything.
- Report options — report-specific settings, like the failing-grade threshold or the absence count that flags a chronic absentee.
- Appearance — styling, covered next.
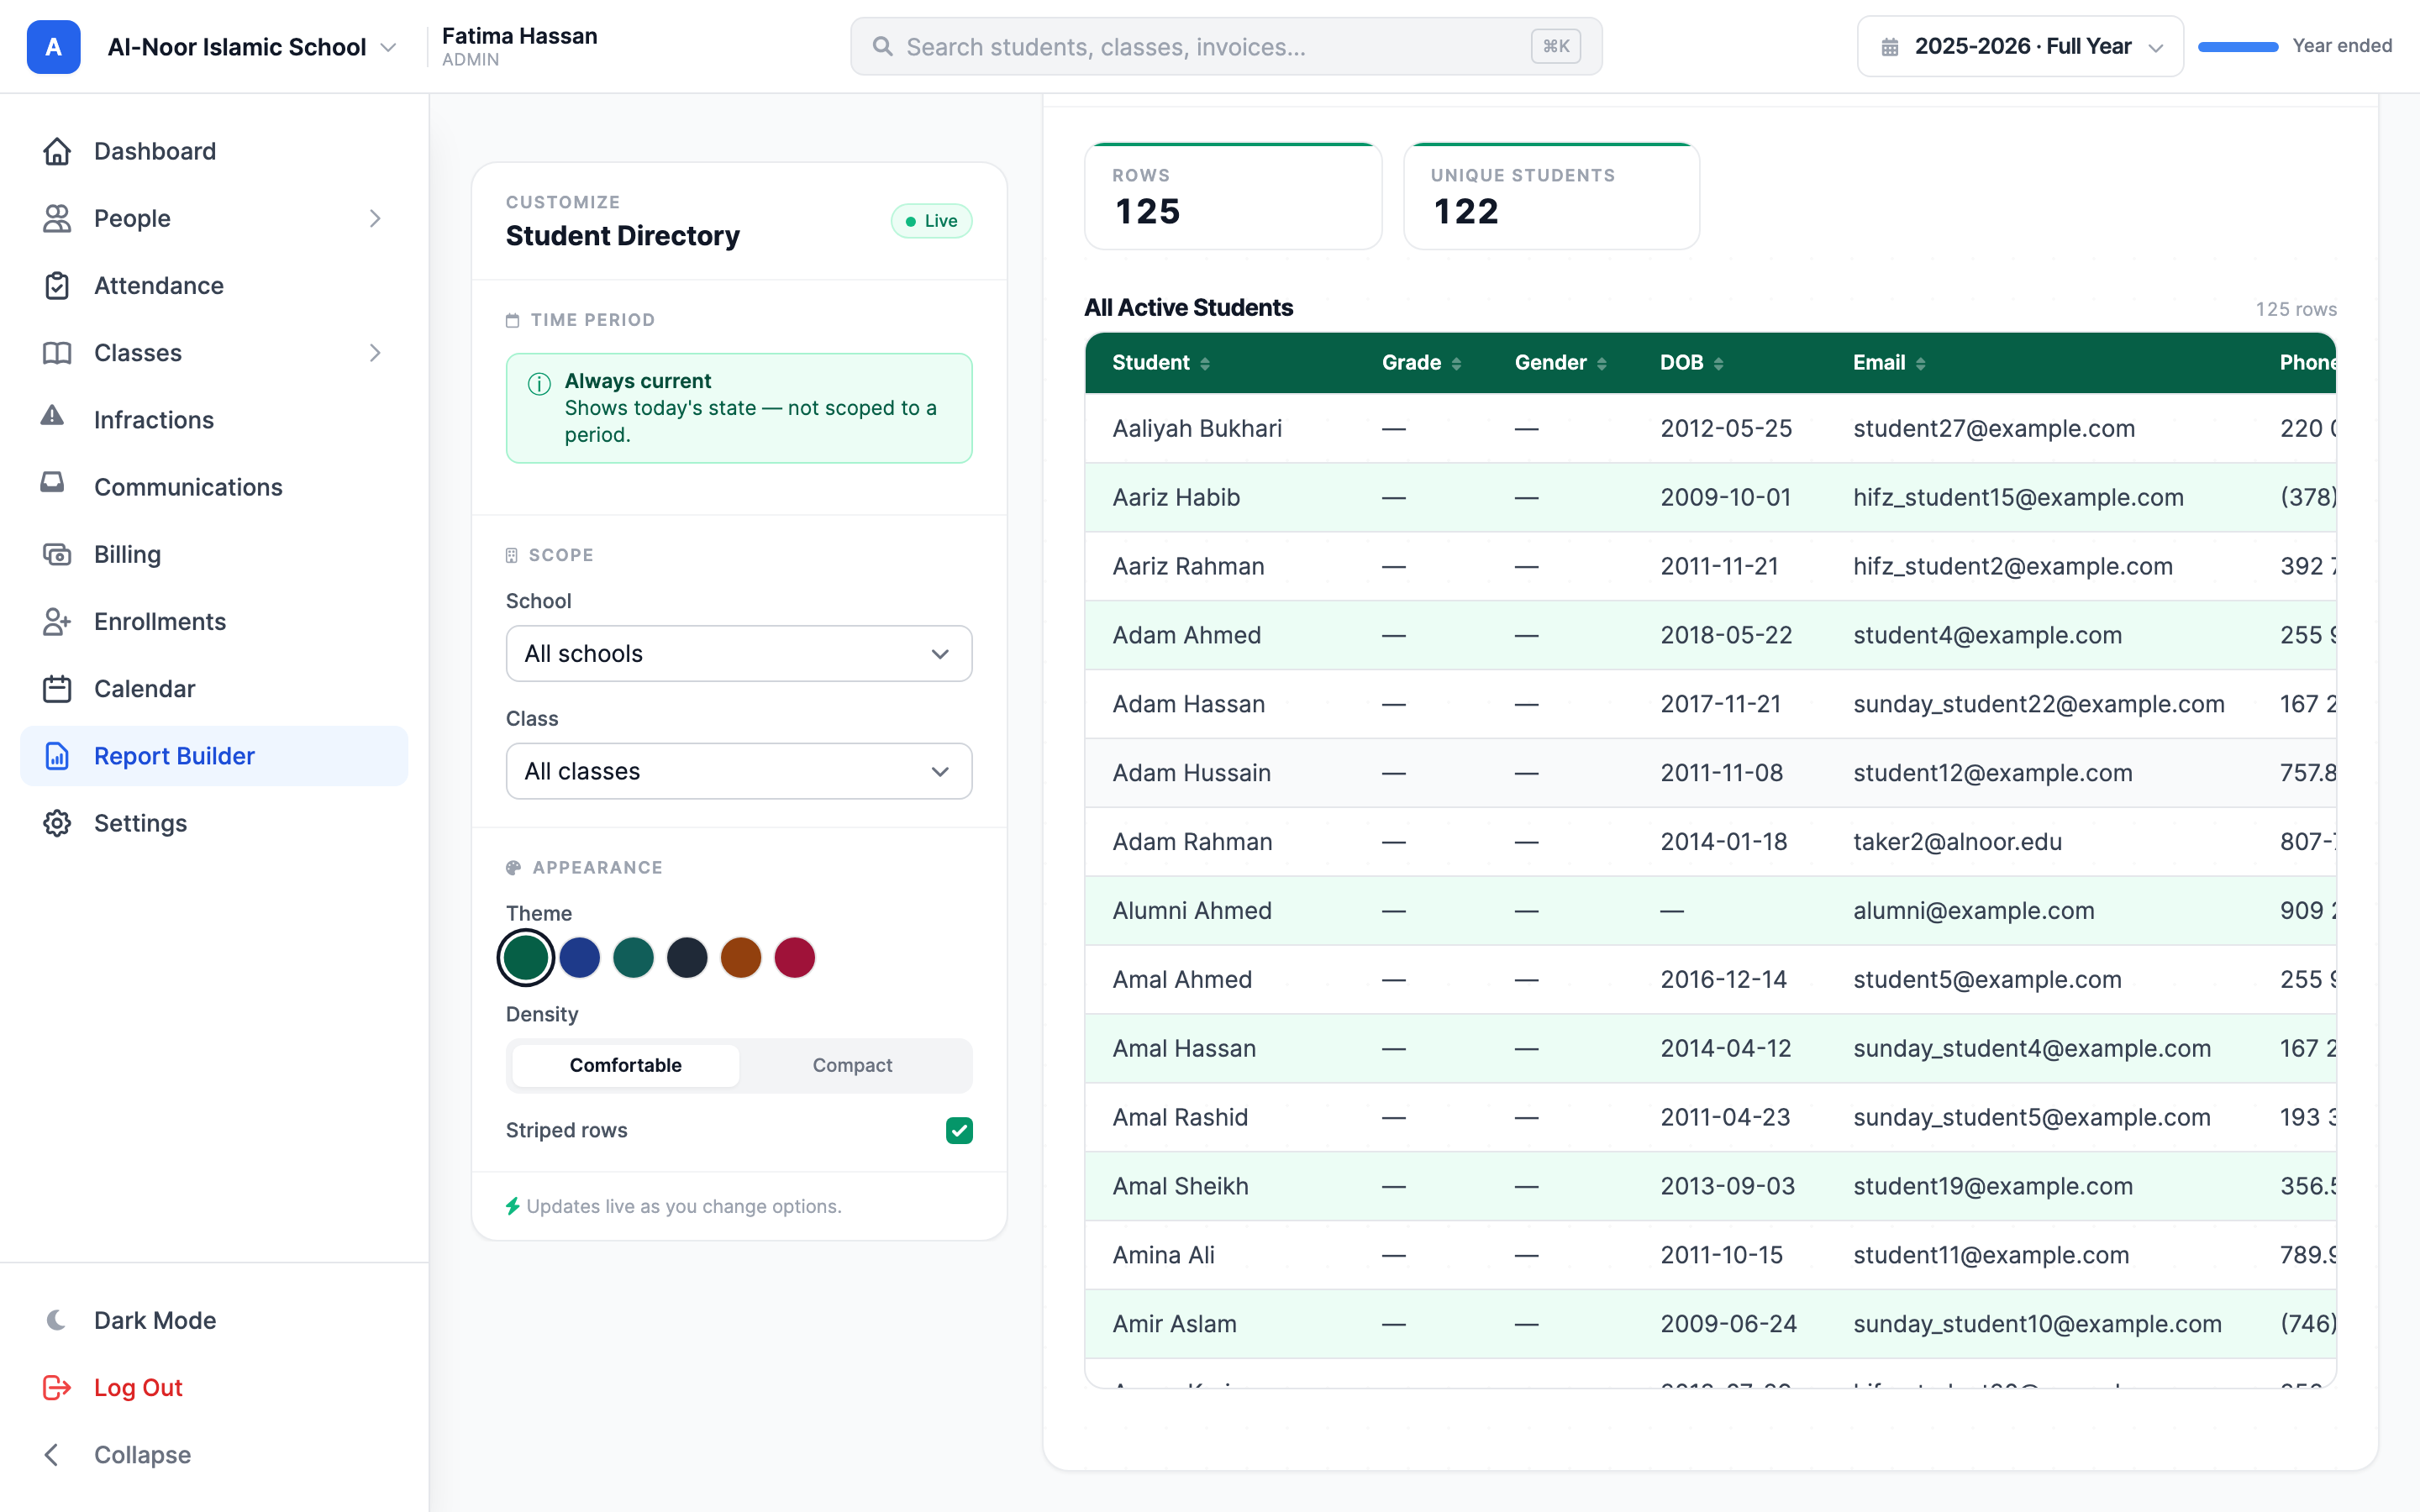
Some reports have no filters
A report like Student Directory or School Profile uses all available data, so its rail simply says "No filters needed." That's expected — just style it and export.
The picker lists are tied to the academic year and term you have selected across the app. If you set up academic years and terms, the Time period section offers your real terms by name. To learn how those windows are defined, see Set up academic years and terms.
Step 3 — Style the report (theme, density, stripes)
The Appearance section at the bottom of the rail controls how the report looks on screen and in the exported PDF:
- Theme — pick a color swatch for the table header and row stripes: Emerald (default), Ocean, Teal, Slate, Amber, or Rose.
- Density — toggle between Comfortable (roomier rows) and Compact (more rows per page).
- Striped rows — turn the alternating row shading on or off.
You can also click a column header in the report to sort by that column. Sorting and styling are part of what gets saved and exported.
Step 4 — Export to PDF or print
The report's title bar holds three actions. First, click into the title field (it reads "Untitled Report") and give the report a name — that name becomes the PDF's filename and its on-page heading.
- Export PDF downloads the report as a polished PDF, themed exactly as you styled it, with the real date window printed in the header.
- Print opens your browser's print dialog showing only the report (the rail and toolbar are hidden), so you can print or "Save as PDF" from there.

Step 5 — Save, reload, and archive reports
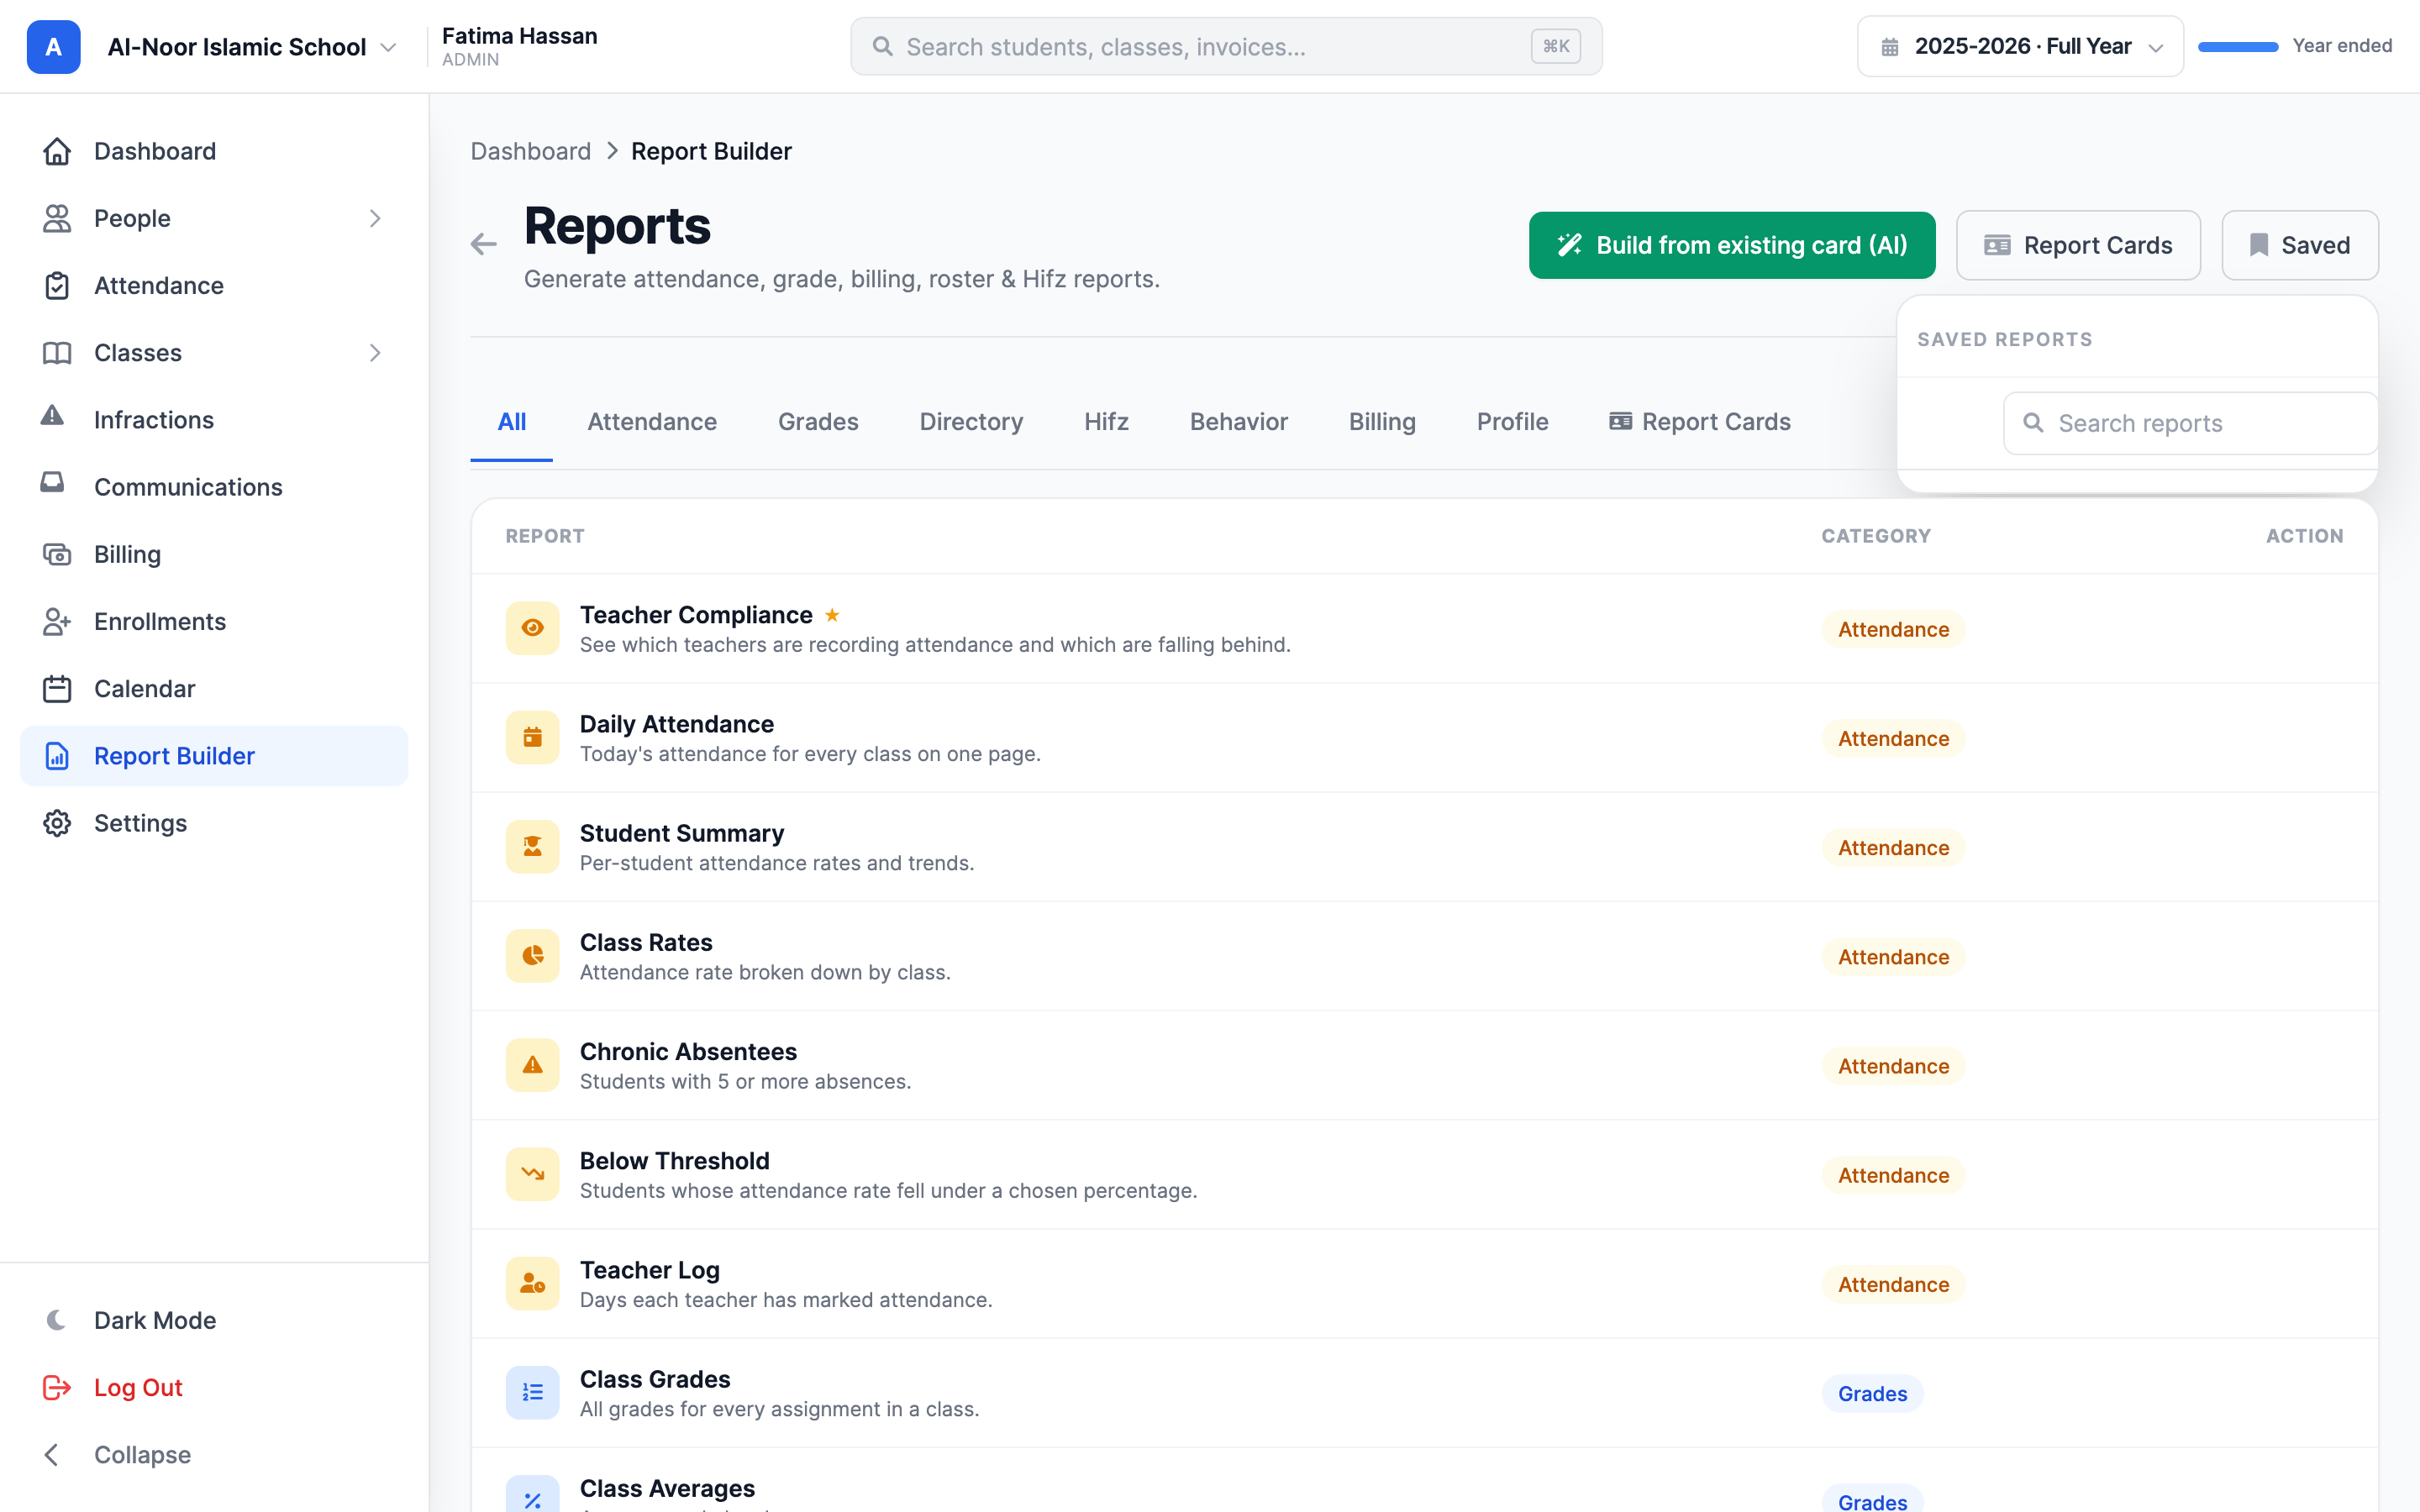
Saving a report stores its filters, styling, and title so you can re-run it next month with one click — and because it always reads live data, a saved report is never stale.
- With a report open and named, click Save in the title bar. It's stored under your account for this school.
- To reopen a saved report, click Saved at the top of the Reports page and pick it from the dropdown. It loads with all its filters and styling restored.
- To remove one, archive it from the saved list. Archiving hides it from your list — it doesn't delete any data, and the underlying records are untouched.
Saved reports are personal and per school
Each saved report belongs to the admin who saved it and to the school it was built in — another admin won't see your saved list, and switching schools shows a different set. Re-run, don't copy: a saved report re-queries live data every time you open it.
That's the report builder
Pick a report, filter it, style it, export or save it. For the formal, per-student report cards that go home to families, see Generate and email report cards. Stuck on a number that looks off? Contact support.
More in Reports
Still stuck?
Our team is happy to walk you through it.