Product · Engineering
Bring your own report card, and AI rebuilds it as a reusable template
Every school has a report card, and no two look alike. A weekend madrasah runs a bilingual grid with a term for each column and an Arabic label beside every subject. A public elementary school reports against standards with a 1–4 scale and a legend at the bottom. A high school prints a transcript with GPA, credits, and letter grades by year. A Montessori classroom writes developmental ratings, not numbers. The card is the one artifact a school will not change to fit your software — parents know it, the board approved it, it is the school's identity on paper.
So most school systems make you rebuild it by hand: drag fields around a template editor, retype every subject, guess at the column layout, and hope the PDF comes out close. It is the single most tedious part of onboarding, and it is where a lot of schools quietly give up.
MarkTrack takes a different route. Upload the report card you already use — a photo, a PDF, a scan, even an Excel file — and our AI reads its structure and rebuilds it as a reusable template inside MarkTrack. This post is the honest, technical walkthrough of how that works, and exactly how well it works, measured against 46 real report cards from schools around the world.
What it looks like
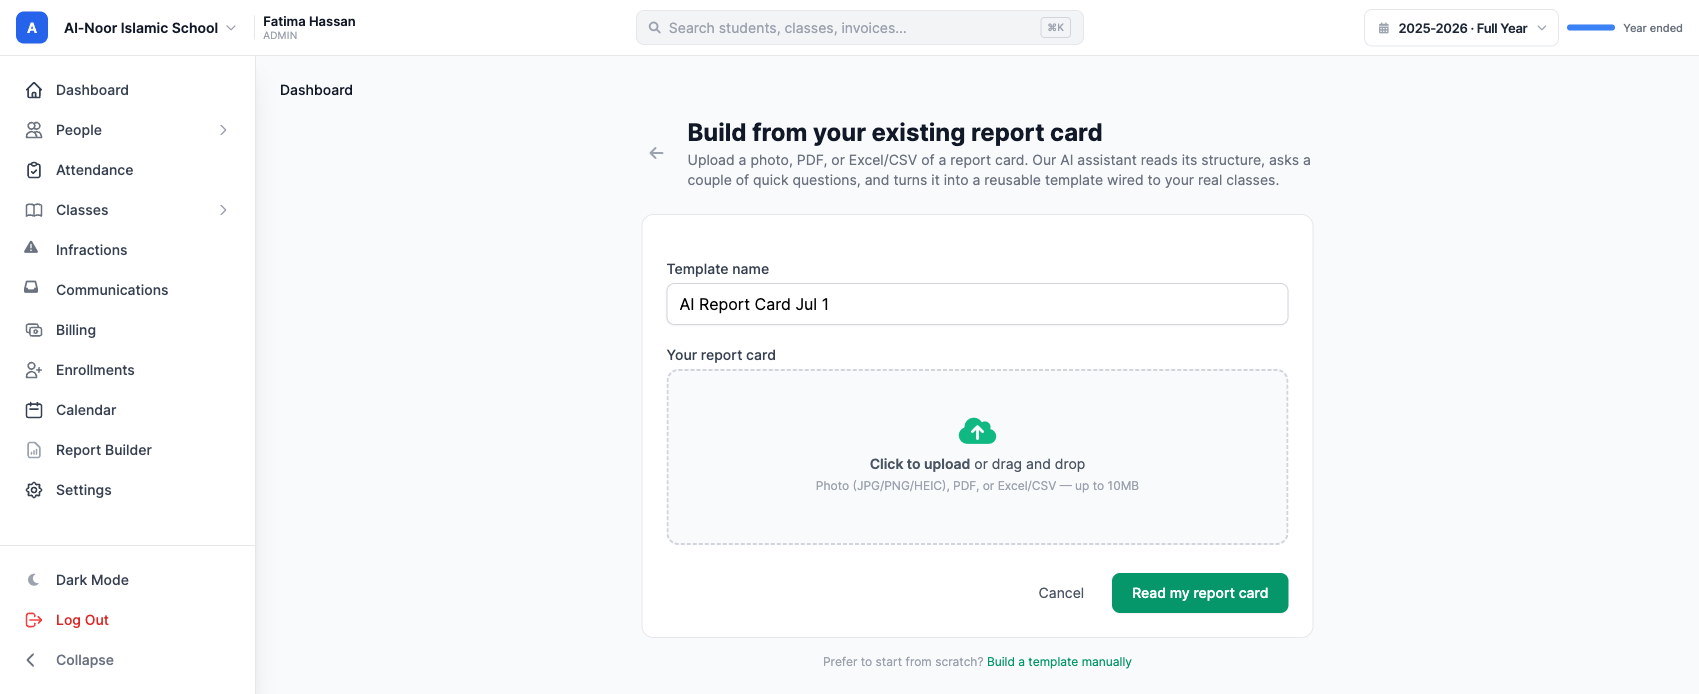
From Report Cards → Templates, you click Build from existing card (AI) and drop your file on the page. That is the whole ask of you.
A few seconds later, MarkTrack shows you what it read — the tables it found, the row and column count, the grading format, and every subject with its label. Here it is on a real bilingual madrasah card: two tables, seventeen rows, fourteen subjects each with its Arabic name preserved, three terms, an Average row, and an attendance block.
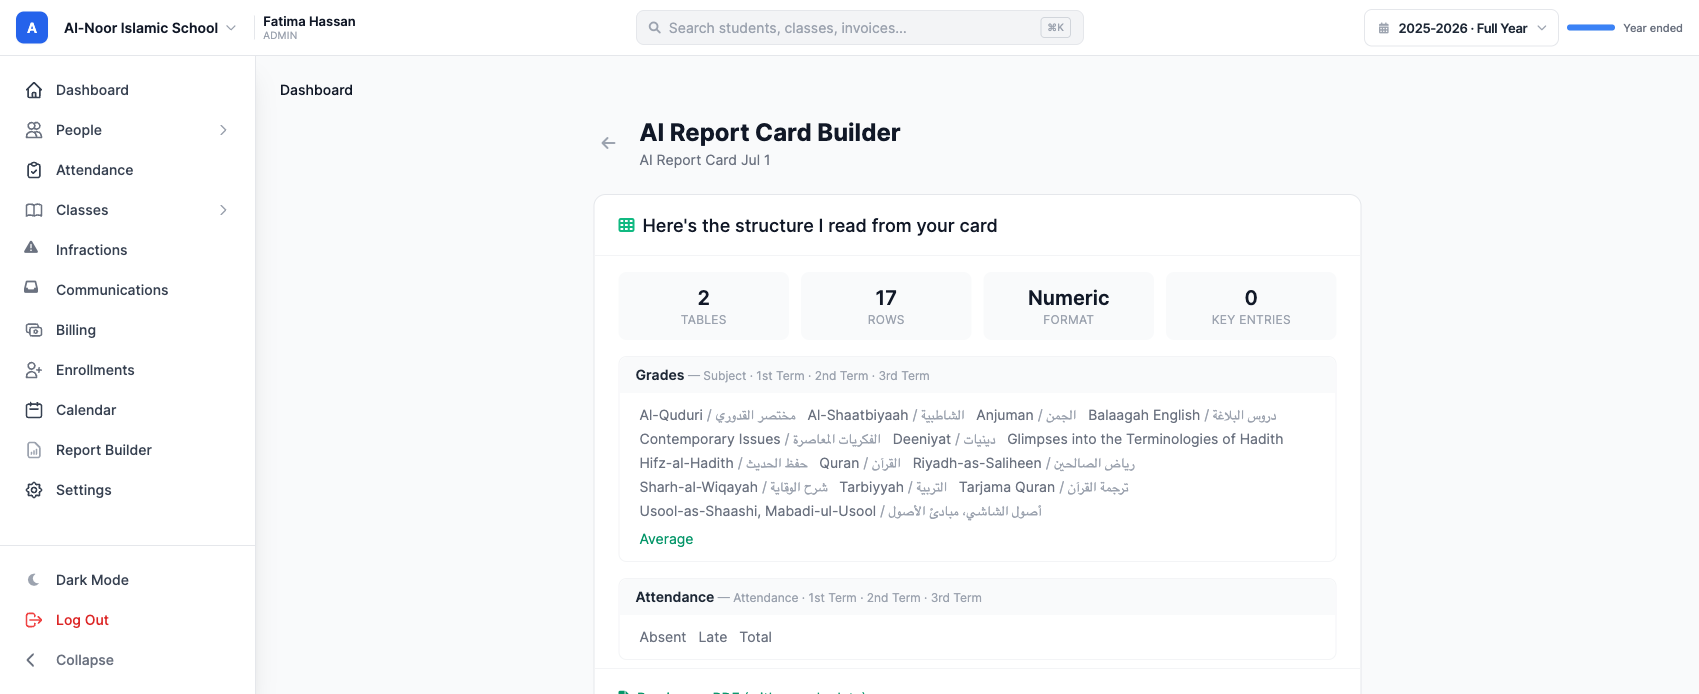
Confirm it, and you have a template you can generate real report cards from — wired to your classes, ready to fill with grades. No dragging fields, no retyping subjects.
The idea: a report card is just a table
The temptation, when you set out to build this, is to hardcode formats: a “madrasah card” type, a “standards-based card” type, a “transcript” type, each with its own parser. That path never ends. There are as many report-card formats as there are schools, and the next school always brings one you did not anticipate.
So we don't model formats. We model the one thing every report card actually is: a set of tables. Rows, columns, cells, section headers, and a legend. Once you see a report card as a generic table structure, the problem stops being “support every format” and becomes “transcribe one table faithfully” — a problem a strong vision model is genuinely good at.
Concretely, the AI returns a single, format-agnostic JSON structure. Trimmed down, it looks like this:
{
  "header": {
    "titles": [{ "text": "Report Card", "lang": "en" }],
    "meta_fields": [{ "label": "Student", "value": "" }]
  },
  "tables": [
    {
      "name": "Grades",
      "columns": ["Subject", "1st Term", "2nd Term", "3rd Term"],
      "row_groups": [
        { "rows": [
          { "label": "Mathematics", "label_secondary": "", "cells": ["A", "B+", "A-"] }
        ] }
      ],
      "aggregate_rows": [{ "label": "Average", "cells": ["88", "85", "90"] }]
    }
  ],
  "legend": [{ "code": "A", "meaning": "90–100" }],
  "value_kind": "numeric"
}
That is it. A numeric madrasah grid, a standards-based elementary card, a college
transcript, and a Montessori narrative all come back in this same shape — the only
difference is what fills it. There is no format-specific code anywhere in the pipeline.
row_groups preserve section hierarchy (a “Mathematics” heading
with skills indented under it), label_secondary holds the Arabic (or any
second-language) name beside a subject, legend captures the grading key, and
value_kind records whether the card grades in numbers, letters/codes, or a mix.
How it works, end to end
There are five stages between your upload and a working template. Here is what each one actually does.
1. Ingestion — turn anything into something a model can see
Report cards arrive as photos, multi-page PDFs, HEIC images off a phone, or spreadsheets. We normalize all of them. PDFs are rasterized page by page; HEIC and other image formats are transcoded; spreadsheets are read straight into a tab-separated grid. Every image is scaled to the resolution the vision model reads best at and encoded for the API.
This stage is unglamorous and full of sharp edges. One that bit us: a dense, full-color scanned transcript can produce a single page image over the API's 10 MB limit, which fails the whole request. We now cap each page (8-bit depth, with a JPEG fallback when a page is still too large) so a heavy scan degrades gracefully instead of erroring out. Little things like that are the difference between a demo and something a real school can rely on.
2. Extraction — Claude reads the table
The normalized page images go to Claude (Anthropic's
claude-sonnet-4-6) in a single request. Two design choices do most of the work:
- Forced structured output. Rather than ask for free text and parse it, we give the model a tool whose schema is the table structure above and require it to call that tool. The response is valid, typed JSON by construction — there is no brittle text-parsing step, and an invalid structure is caught and re-prompted once before we ever show you anything.
- Faithful transcription, not interpretation. The prompt's entire job is to make the model an OCR-and-structure transcriber: copy every row and every cell verbatim, preserve top-to-bottom and left-to-right order, keep bilingual text as-is, never translate, never invent, and mark a blank cell blank. When a card spans multiple images (“page 1 of 2”), all pages go in one message and are merged into one structure.
A lot of the engineering here is in the prompt, and it is never “done.” Getting legends captured verbatim instead of paraphrased, keeping per-group subtotals in place instead of collected at the bottom, reading rotated column headers left-to-right — each of these was a measured change, benchmarked, kept or reverted. More on that below.
3. Structure → template
The extracted structure still has the sample card's values in it. To make a reusable template, we strip the cell values and keep the skeleton: the titles, the tables, the column headers, the row labels (bilingual intact), the section grouping, and the legend. That skeleton is stored as JSON on the template and is what every future report card is generated from.
4. Rendering
A single, format-agnostic renderer turns any skeleton back into a clean PDF: header and meta fields, each table with its column headers and shaded section rows, aggregate rows, and the legend. It is completely decoupled from the data — feed it real grades and it prints a finished card; feed it nothing and it prints the blank template. Because it is one renderer for all formats, a bilingual grid and a standards-based card come out equally clean.
5. Correctability
AI is not going to be perfect on the first read of every card, so nothing is a black box. You see the full extracted structure before it is saved, you can re-read the card, and your template's structure is preserved through edits — renaming or adjusting a template never silently discards the extracted layout. Direct structural editing (add or rename a row, a column, a legend entry) is the next piece we are building on top of this same data model.
How accurate is it, really?
Here is where most feature pages say “99% accurate” and move on. We are not going to do that, because that number is meaningless without saying accurate at what, on which cards, measured how. So here is the real answer, with the arithmetic.
We built a benchmark of 46 real report cards pulled from the public web — not our own demo cards. They span 12 categories and five countries (United States, Canada, United Kingdom, Australia, Finland): standards-based and letter-grade elementary cards, middle-school and high-school report cards, high-school and college transcripts, homeschool cards, IB / Cambridge / AP score reports, Montessori narrative reports, kindergarten developmental cards, and special-ed IEP goal reports. Grading styles run from percentages and GPA to 1–4 standards, IB 1–7, checkmarks, and prose ratings.
Each card went through the exact production pipeline. Then an independent vision model compared our extracted structure against the original image and scored it from 0 to 100 on seven structural dimensions — did we capture the header, every table, the full column set, every row, the cell values in the right columns, the section hierarchy, and the legend. Averaging across all 46 cards:
| Structural dimension | Mean score (/100) |
|---|---|
| Rows captured (no drops, no duplicates) | 94.8 |
| Legend / grading key | 94.8 |
| Header & meta fields | 94.6 |
| Tables found (none missing or invented) | 94.5 |
| Cell values in the right columns | 93.9 |
| Columns (complete & correctly ordered) | 90.9 |
| Section hierarchy / grouping | 90.4 |
| Overall structural parity | 90.0 |
So the headline is 90% average structural parity. But the average hides the shape of the results, which matters more:
- 29 of 46 cards scored 90 or above, 16 scored 80–89, one scored in the 70s, and none scored below 70.
- All 46 were judged reusable as a faithful template skeleton — i.e. good enough to build real report cards from, with at most minor cleanup.
- At the row level, across all 46 cards there were 2,591 data rows; we captured 2,536 of them — 97.9%. We got the row count exactly right on 33 of 46 cards, and within a single row on 37 of 46.
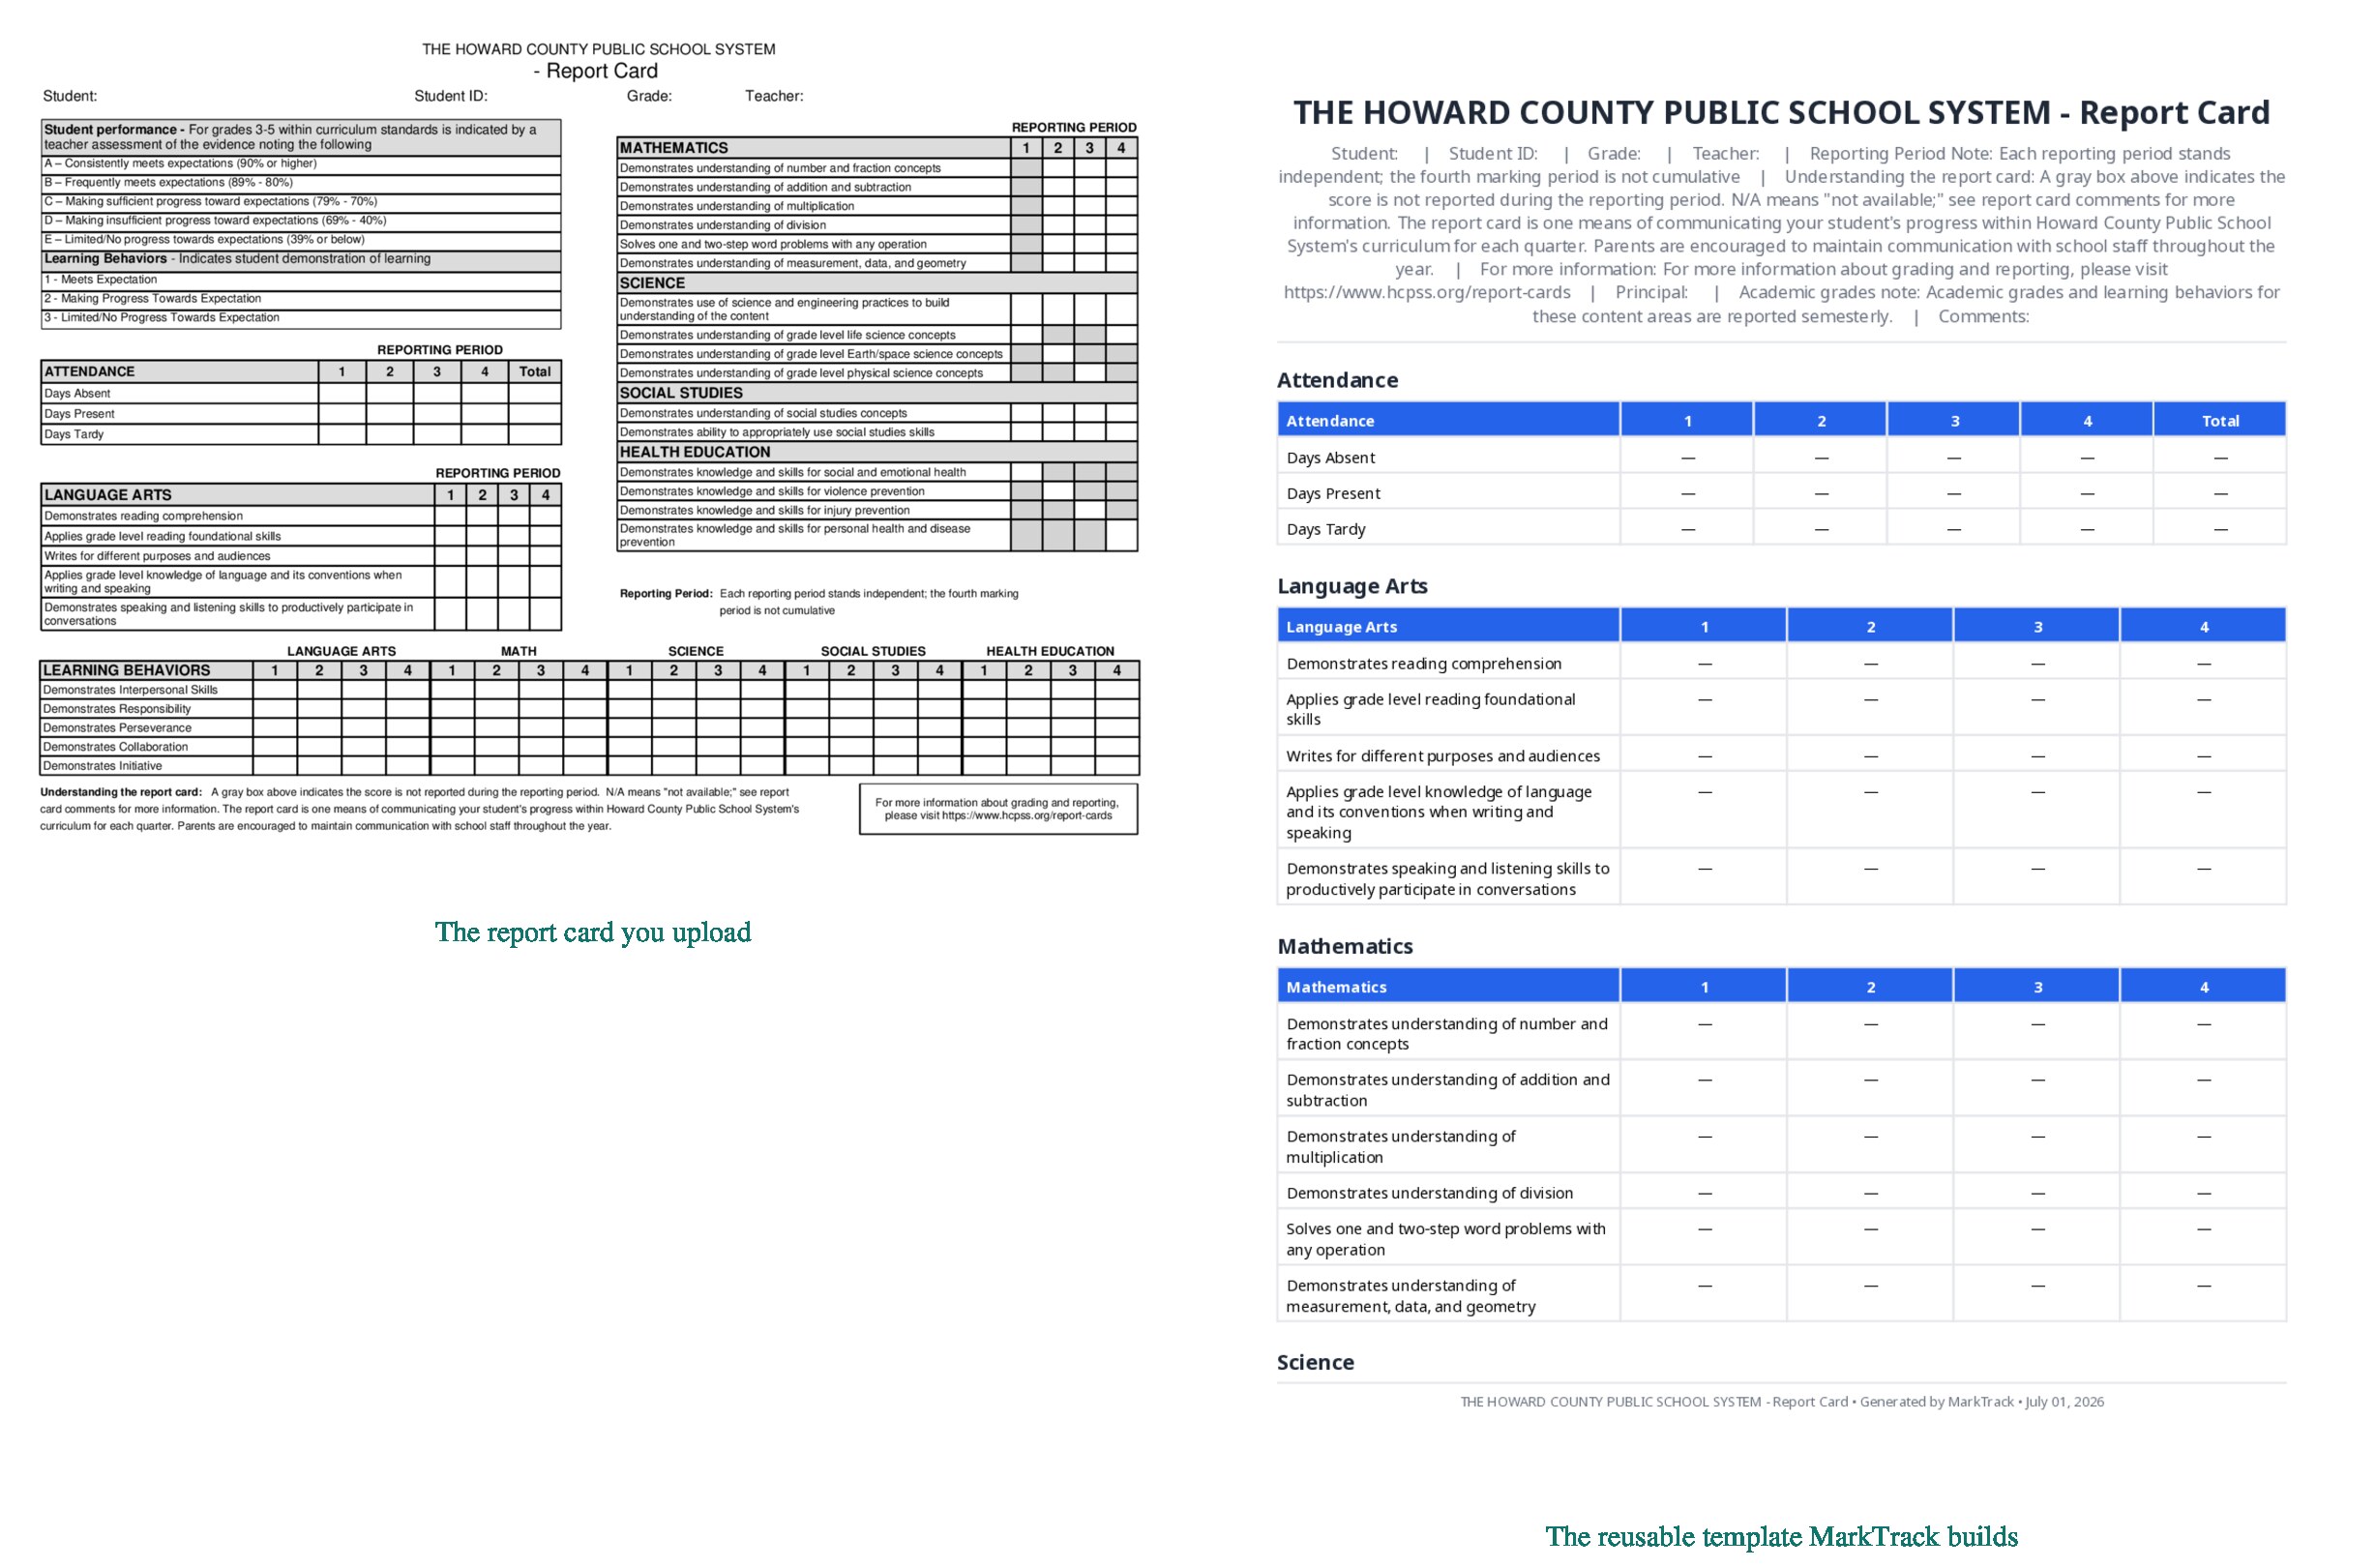
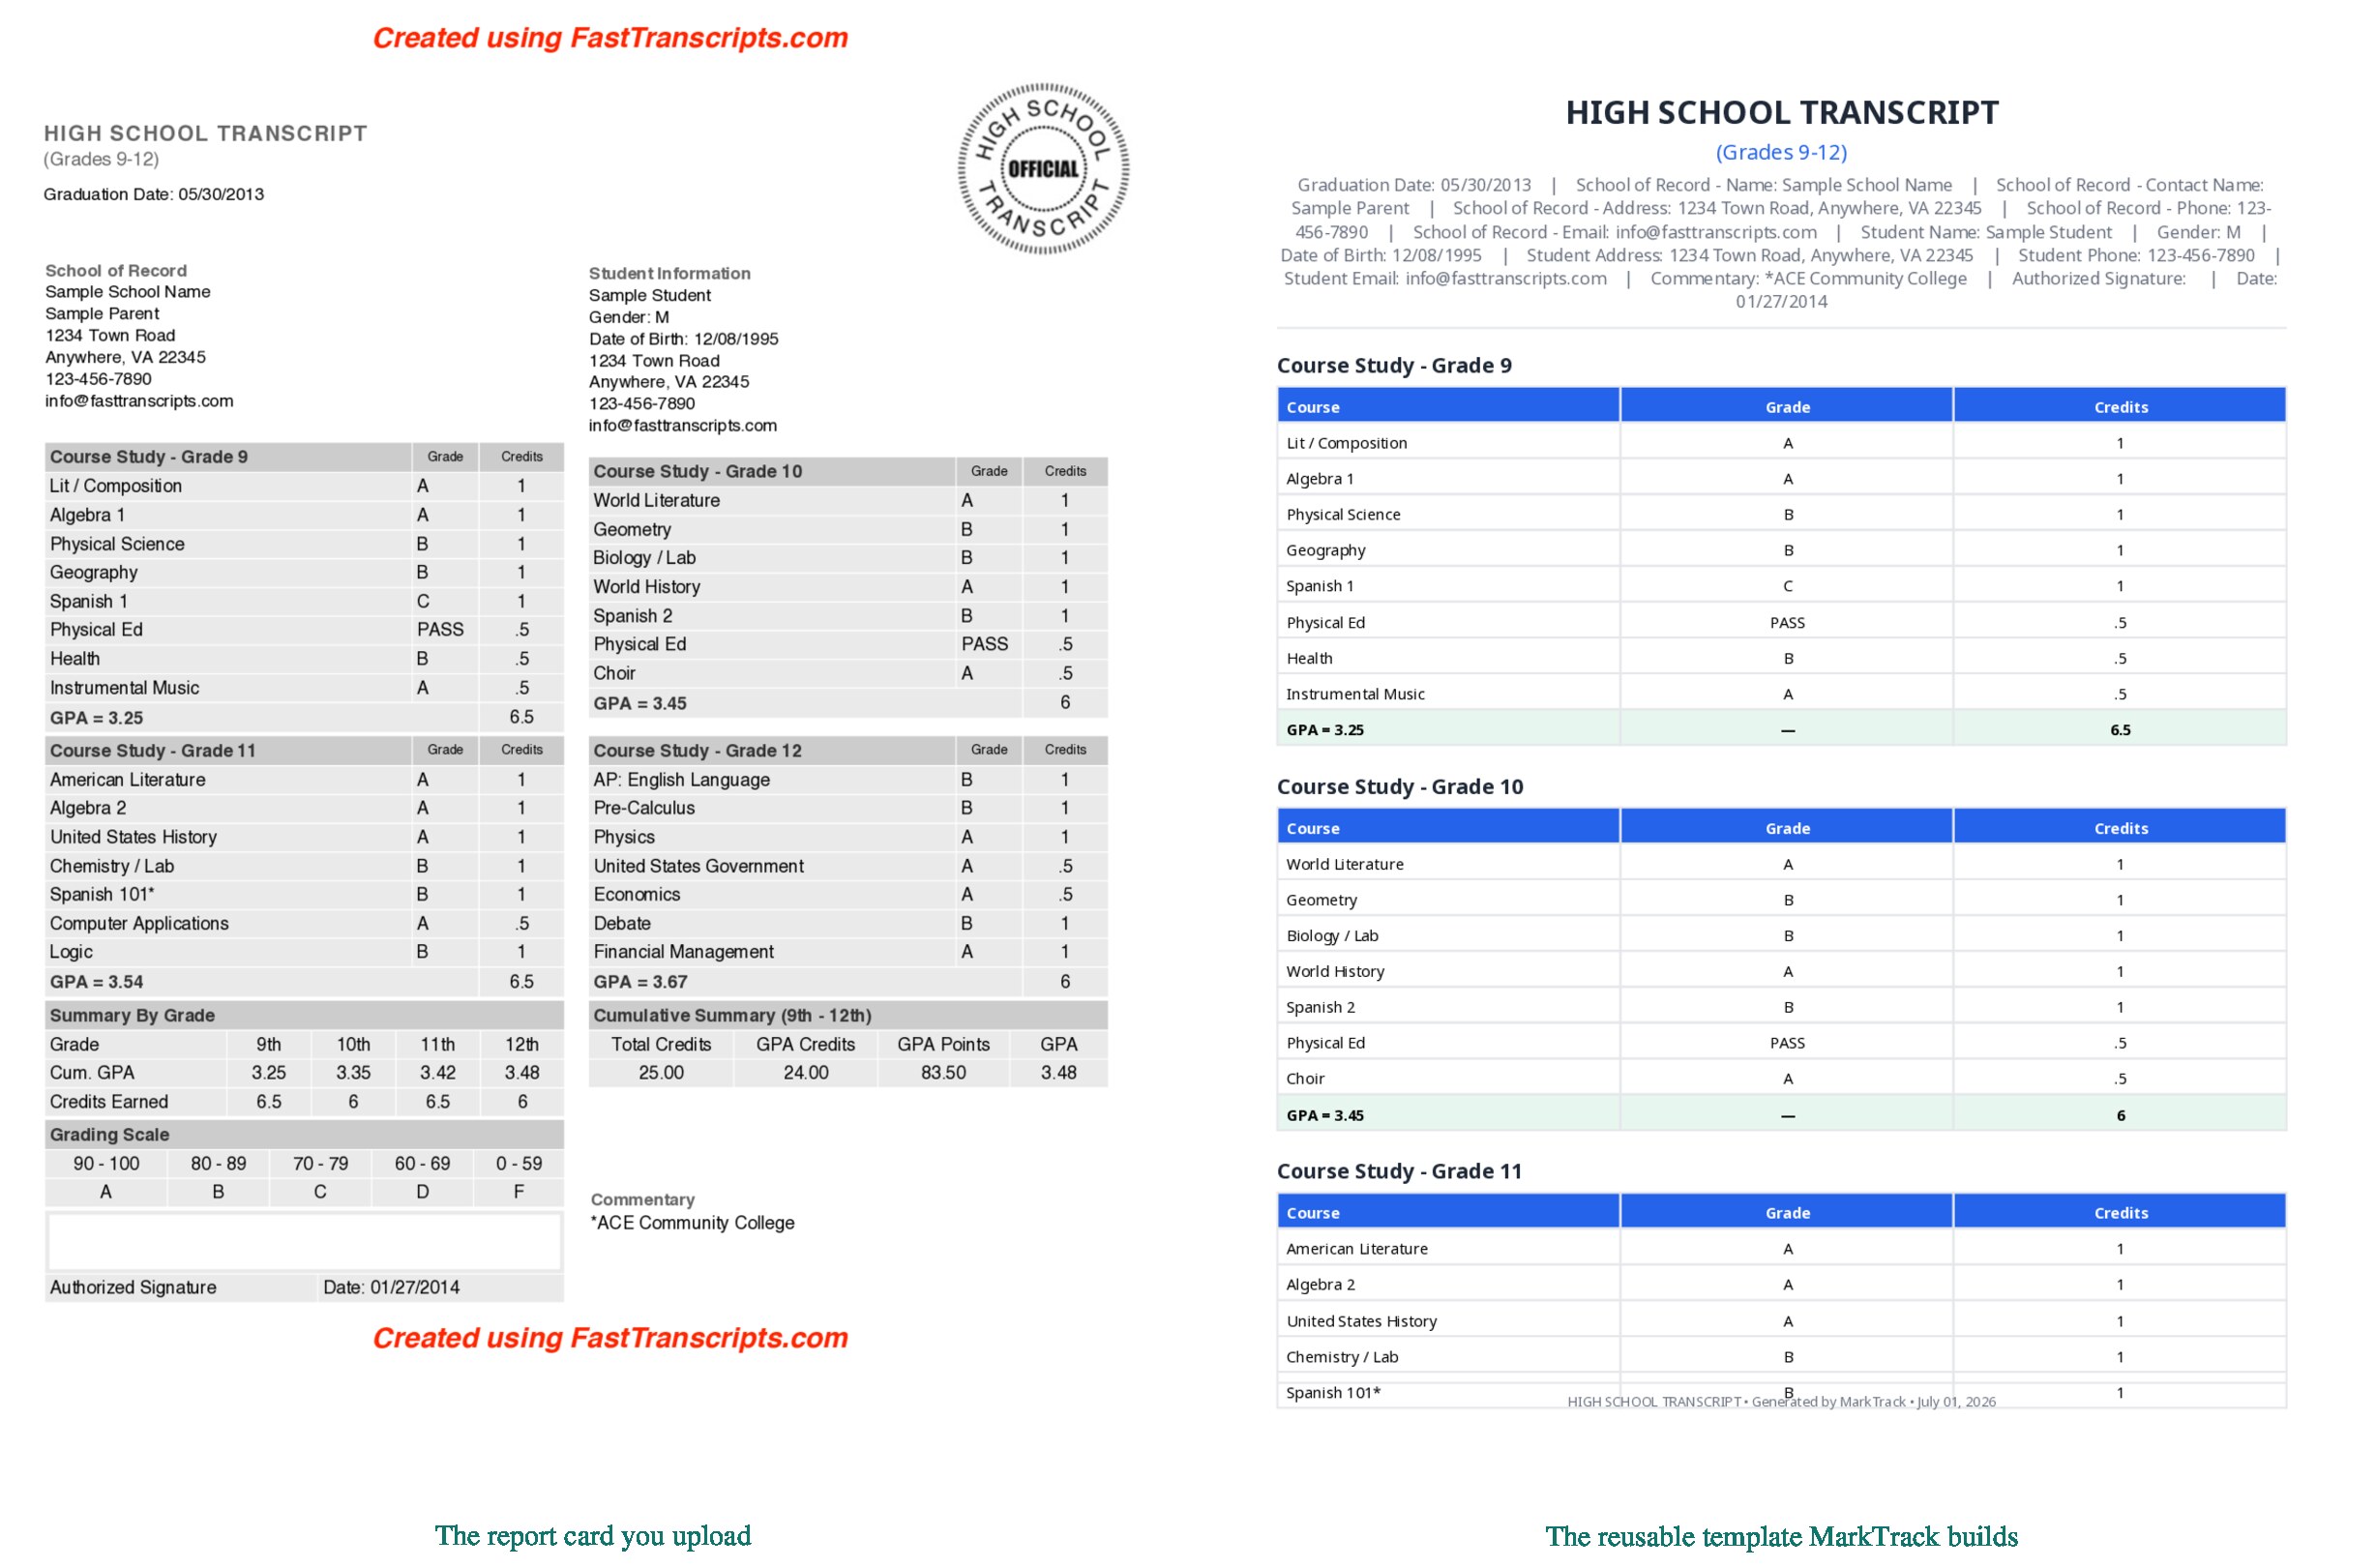
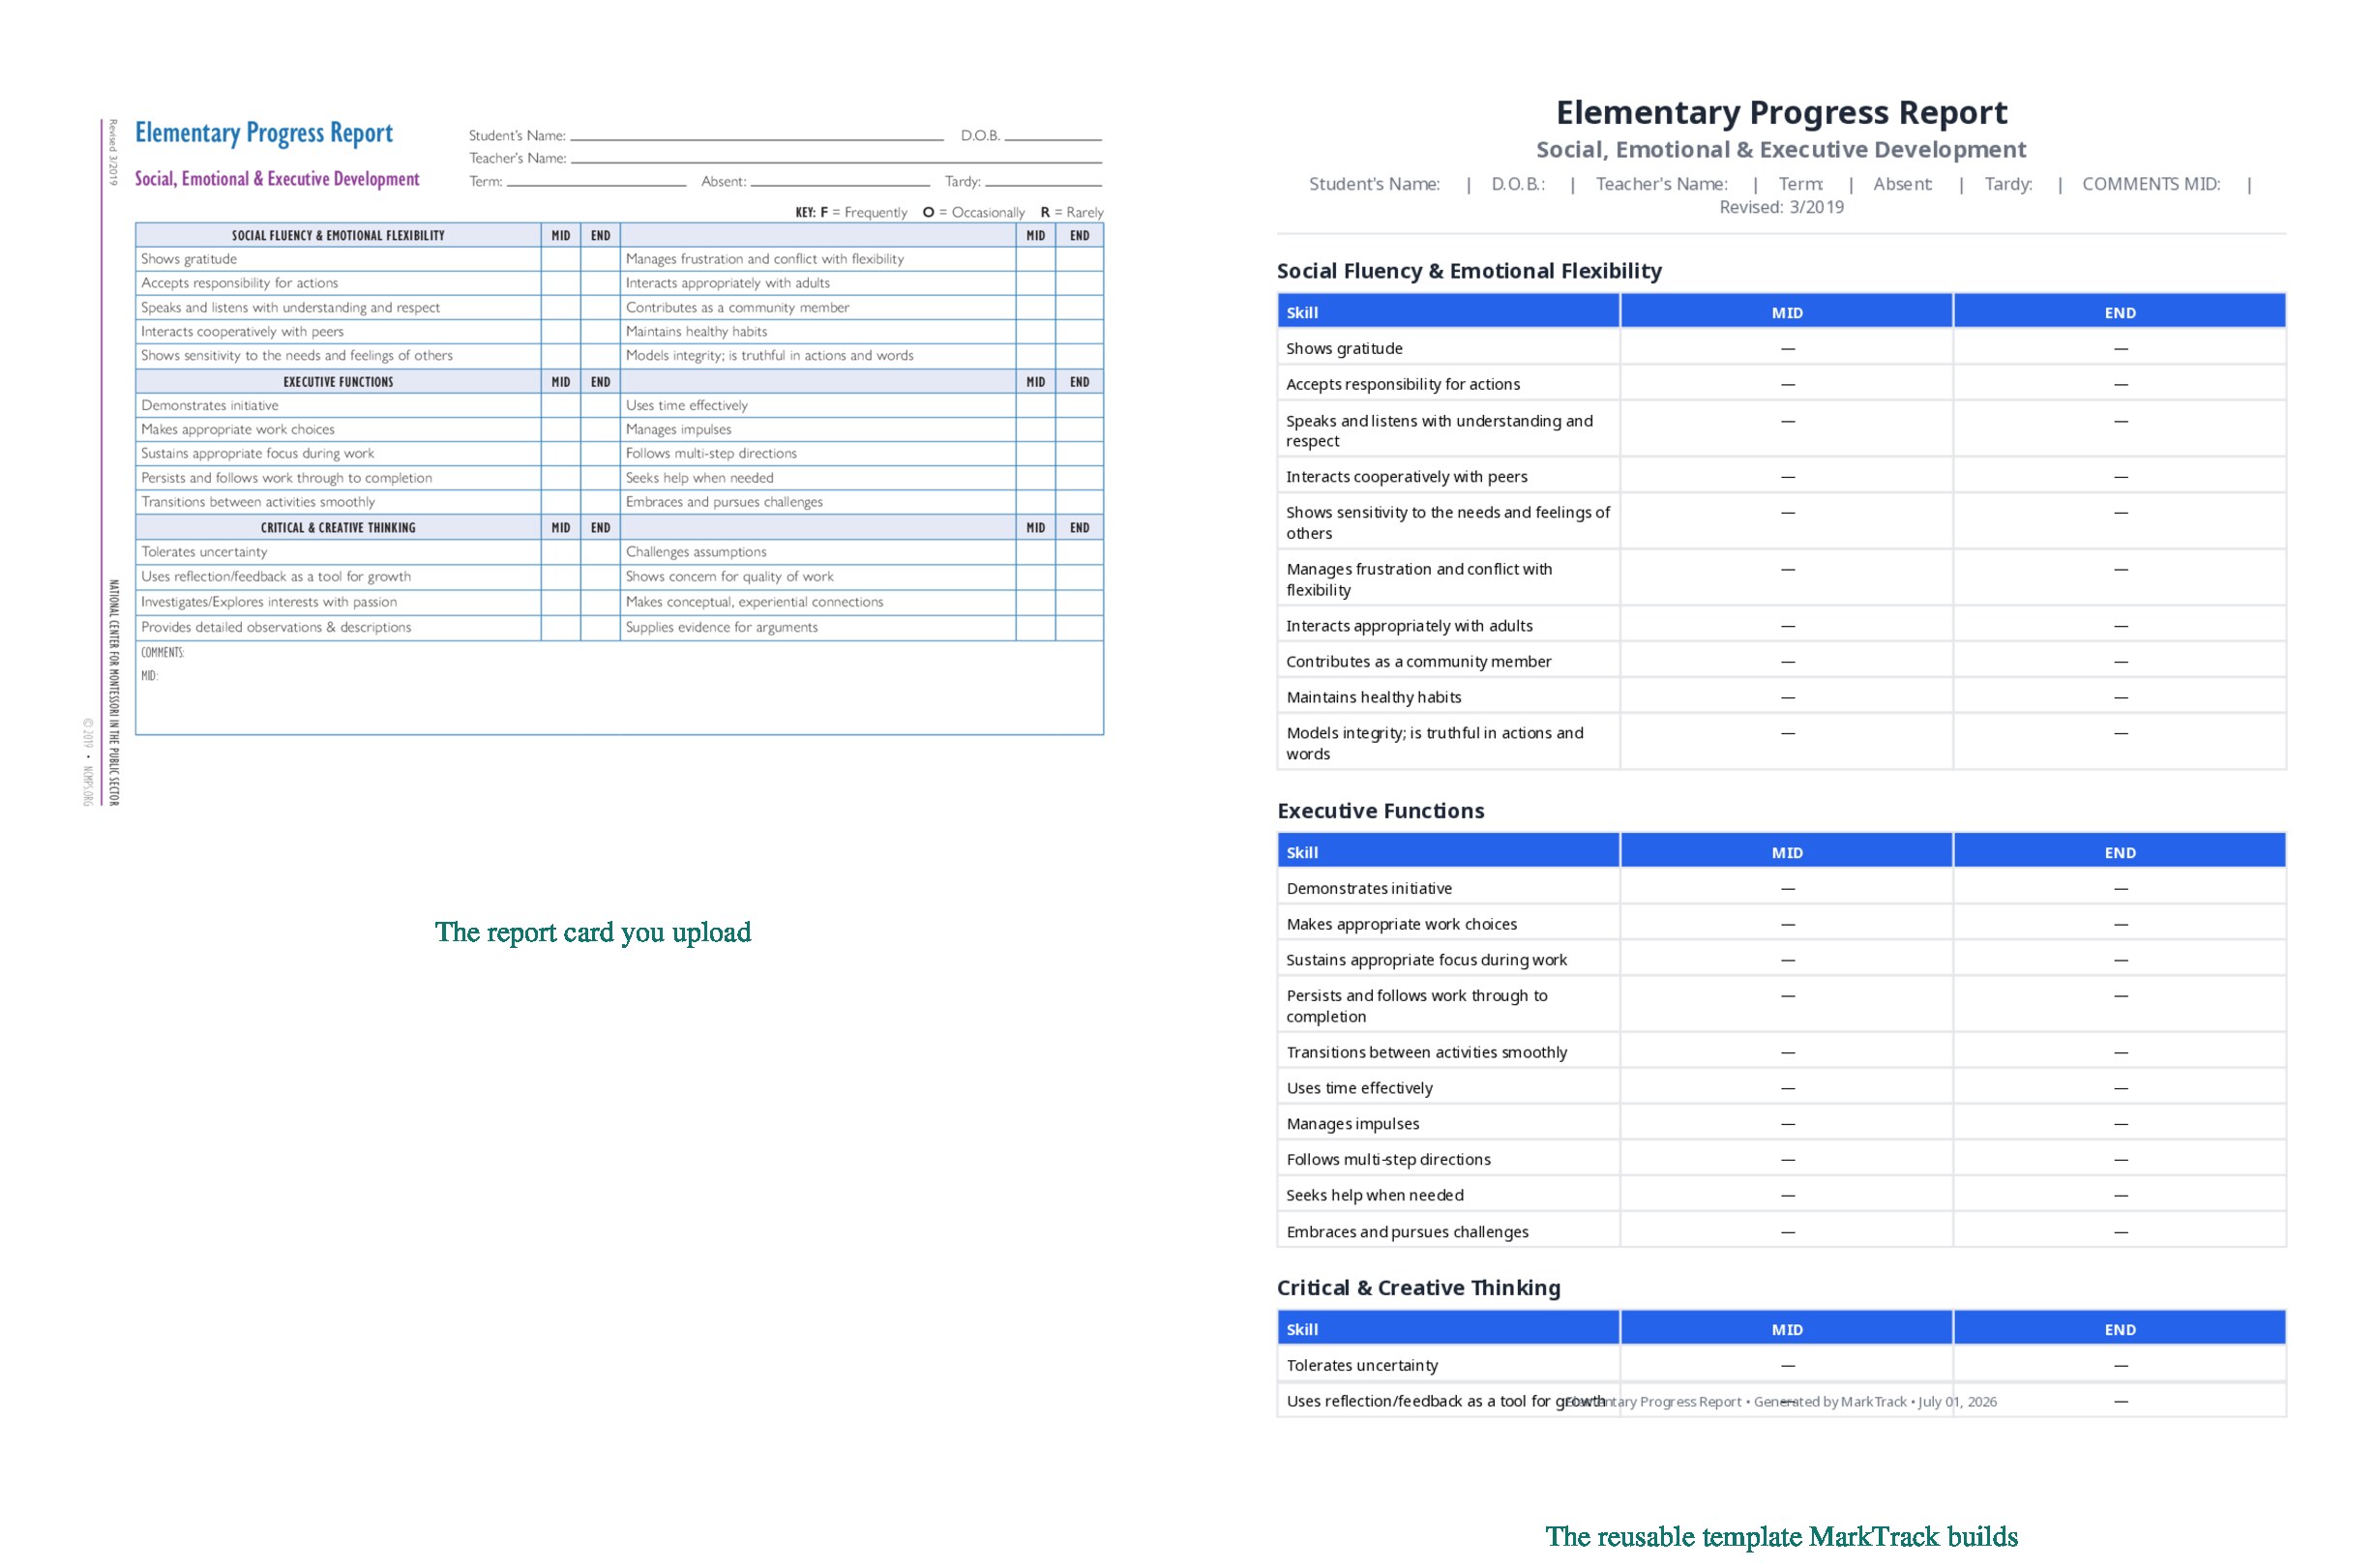
Here is what that looks like on three genuinely different cards — the report card on the left, and the reusable template MarkTrack built from it on the right.
Where it still falls short — and why we won't say 99%
The two weakest dimensions in that table are the honest ones: columns (90.9) and hierarchy (90.4). A handful of specific things remain hard, and we would rather name them than round up:
- Rotated and stacked column headers. When a card prints its column labels sideways or stacks two header rows, the model occasionally reads them in the wrong order. This was the single lowest-scoring card in the set.
- Dense, multi-scale legends. Cards that define two different grading scales, or bury the key in a footnote, are the most common place a detail slips.
- Non-table content. Free-text teacher-comment boxes, graduation-requirement checklists, and color-shading semantics (“a grey cell means not assessed”) are not really tables, and a table extractor captures them imperfectly.
- Messy sources. Some public samples are themselves poorly built — a garbled PDF text layer, or several different transcripts merged into one file. The model faithfully reproduces the mess, which is correct but scores lower.
A single “99%” would paper over all of that. “90% average structural parity, 46 of 46 reusable, 97.9% of rows captured, weakest on rotated columns and dense legends” is a longer sentence, but it is one you can actually trust — and it is why every extraction shows you the full structure to confirm before it is saved.
The stack, briefly
For the technically curious: the vision extraction runs on the Claude API
(claude-sonnet-4-6) with forced tool-use for typed output; ingestion and PDF
rasterization run server-side off the request thread so the upload feels instant; the
structure is validated against a strict schema (and re-prompted once on failure) before it
is ever persisted; templates are stored as plain JSON; and rendering is a single Prawn-based
engine that reads that JSON and fills it from any values source — synthetic demo data,
or your students' real grades. The same data model is what the upcoming structural editor
will edit. No format-specific branches, from ingestion to PDF.
Try it on your own card
The best test is your actual report card. Take a photo of it, or export the PDF, open Report Cards → Templates → Build from existing card (AI), and drop it in. In a few seconds you will see your card's structure read back to you — and if the AI missed something, you will see exactly what, before anything is saved.
If you are still comparing MarkTrack against your current system, or want to see how the rest of onboarding works, the AI roster import uses the same bring-what-you-have philosophy for your student list.
Interested in trying out MarkTrack for free?
Get in touch